Viewing the recent uplink/downlink activity of a device
-
Select Devices.
-
On the List tab, click the name of the device for which you want to view the last 10 uplink/downlink frames.
-
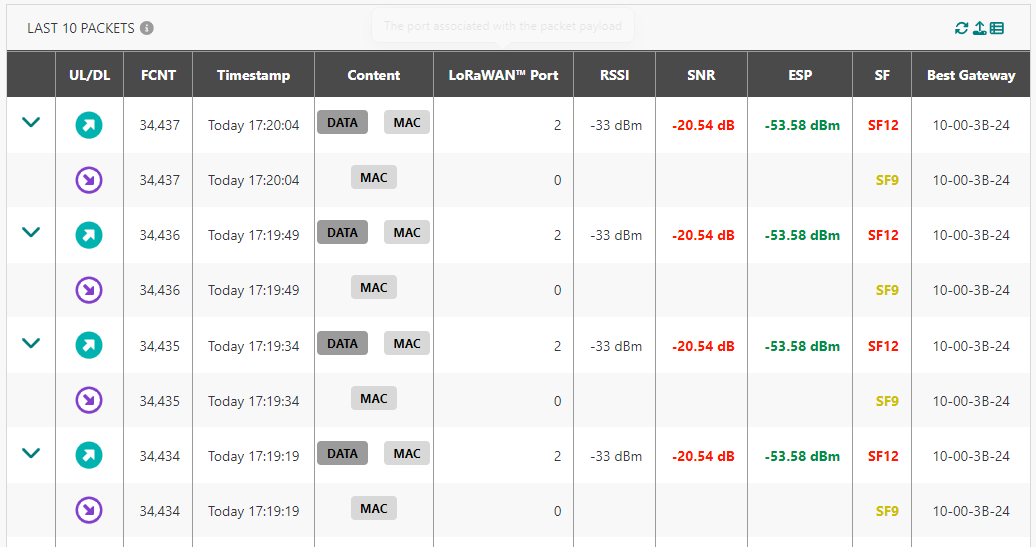
Go to LAST 10 PACKETS.
-> The last 10 uplink/downlink frame sequence is displayed as follows:
-
In the UL/DL and Content columns, you can see a graphical representation of the packet type and the packet content. To learn more, see Uplink LoRaWAN® packets and Downlink LoRaWAN® unicast packets.
-
For each type of radio activity of a dedicated uplink or downlink packet, a range value is defined as illustrated in the following table.
Radio metric Range High Range Low Unit ESP 0 - 142 dBm RSSI 0 - 125 dbm SNR 15 - 24 dB SF 7 12 SF A color code is associated with each value or range value as depicted in the following table.
Color RSSI SNR SF ESP 
n/a SNR ≤ -16.5 12 - 135 
n/a -14 ≤ SNR < -16.5 11 - 130 
n/a -11.5 ≤ SNR < -14 10 - 120 
n/a -9 ≤ SNR < -11.5 9 - 110 
n/a -7 ≤ SNR < -9 8 - 100 
n/a SNR > -7 7 - 90 -
Scroll down and click SHOW ALL.
-> This takes you to the Wireless Logger application to view the entire traffic history and obtain additional details. To learn more, see Using network tools.