Monitoring the radio statistics of the devices
-
Select Devices.
-
On the List tab, click the name of the device for which you want to check the radio statistics.
-
In RADIO STATISTICS you can select one of the available tabs
- Received uplinks versus the lost ones (Received/Lost)
- Estimated Signal Power (ESP)
- Received Signal Strength Indicator (RSSI)
- Signal to Noise Radio (SNR)
- Spreading Factor (SF).
-
By default the Received/Lost tab is displayed
-> The statistics issued for received or lost uplinks appear as follows:

Received uplinks are the sum of on-time and late uplinks. For more information about late uplinks, see Checking the radio communication history.
A lost uplink is an uplink that has never been received by the ThingPark Enterprise platform. The lost uplink is detected when the ThinkPark Enterprise platform receives the next uplink.
-
Select the ESP tab.
-> The Estimated Signal Power appears as follows:
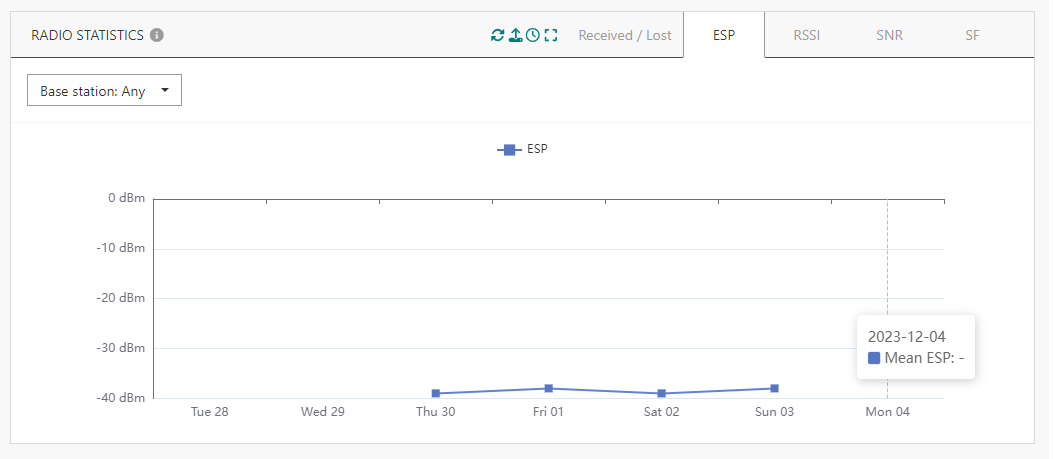
On the ESP tab (also applicable to RSSI and SNR tabs), the graph can be displayed for a specific base station. By default, the graph shows ESP of “any” base station. In this case, ESP are the ones of the best gateway for each uplink, averaged over hourly or daily periods.
You can select one of the three base stations that received the last uplink of the device. The label is the LRR ID. In this case ESP are the ones of the selected base station for each uplink received by this base station, averaged over the hourly or daily periods."
-
Select another tab if you want to display the RSSI, the SNR or the SF.
For more information about ESP, RSSI and SNR, see Analyzing LoRaWAN® traffic.