Monitoring radio statistics of a LoRaWAN® device
You can display charts representing the following radio statistics to help you monitor or troubleshoot a LoRaWAN® device:
-
Packet Error Rate (PER) with Instant PER and Mean PER
-
Estimated Signal Power (ESP)
-
Received Signal Strength Indicator (RSSI)
-
Signal-to-Noise Ratio (SNR)
-
Spreading Factor (SF)
This information is read-only. For more information about how devices radio statistics is defined and computed in Device Manager, see More about LoRaWAN® radio statistics.
On the charts, you can display the following details for each device:
-
Daily average or Scatter packets (Distribution or Scatter packets for SF)
-
Over the Last 7 days or the Last 15 days
-
For All LRRs, or a specific LRR, in the range of the device (Does not applies to SF).
Tips
-
Hovering your mouse over an item of the chart displays additional traffic information.
-
Clicking an item of the caption makes it disappear/appear in the chart and adjusts the scale.
-
In the navigation panel, click Devices to display the Devices panel, then click the List or the Map tab.
-
Select the device you want to check the activity. Click View or Edit to enter the Device panel.
-
Scroll down the Device panel to display the PER, ESP, RSSI, SNR and SF tabs with the charts.
-
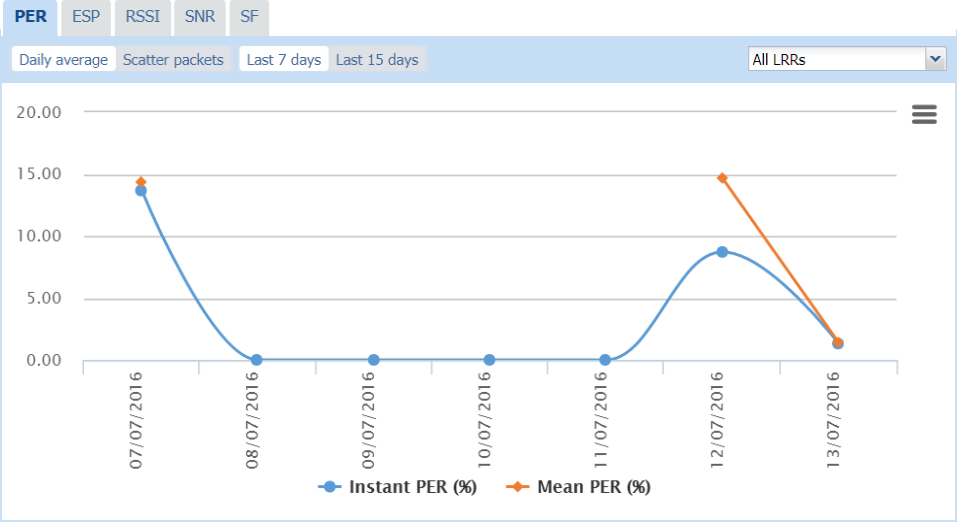
Click the PER tab, then:
-
Click Daily average and Last 7 days, or Last 15 days, to view:
-
The daily average PER of the device over the selected period for all LRRs.
-
If available, select a specific LRR in the All LRRs list to display the Instant PER per LRR that is computed considering only the uplink frames received by a specific LRR.
-
-
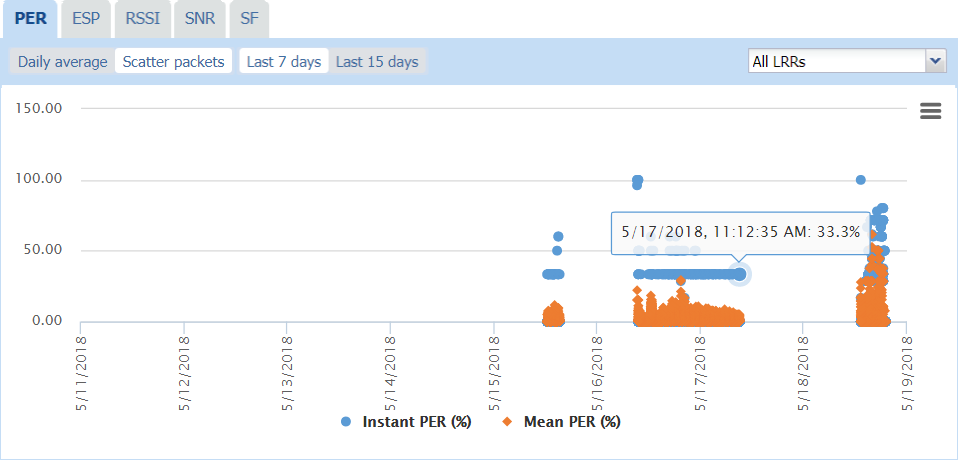
Click Scatter packets and Last 7 days, or Last 15 days, to view:
-
The device PER per packet over the selected period for all LRRs. If available, you can select a specific LRR in the All LRRs list.
-
-
-
Click the ESP tab, then:
-
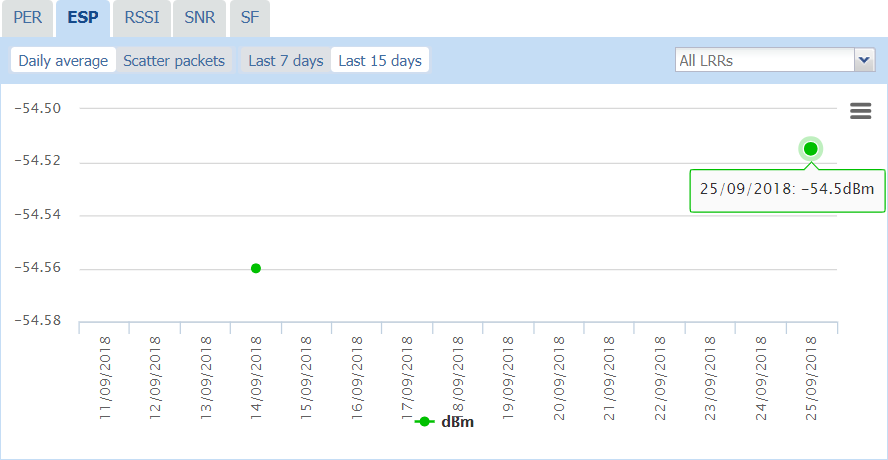
Click Daily average and Last 7 days, or Last 15 days, to view:
-
The daily average ESP of the device over the selected period for All LRRs. If available, you can select a specific LRR in the All LRRs list.
-
-
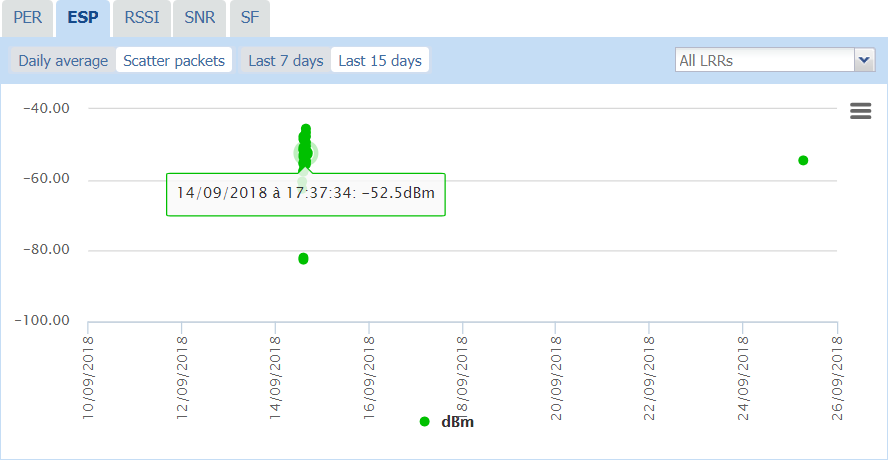
Click Scatter packets and Last 7 days, or Last 15 days, to view:
-
The device ESP per packet over the selected period for all LRRs. If available, you can select a specific LRR in the All LRRs list.
-
-
-
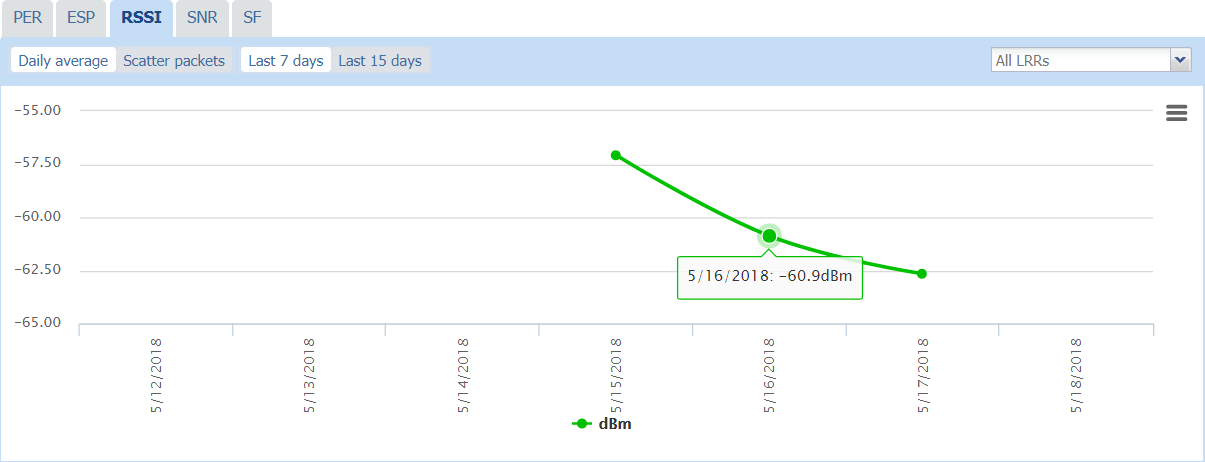
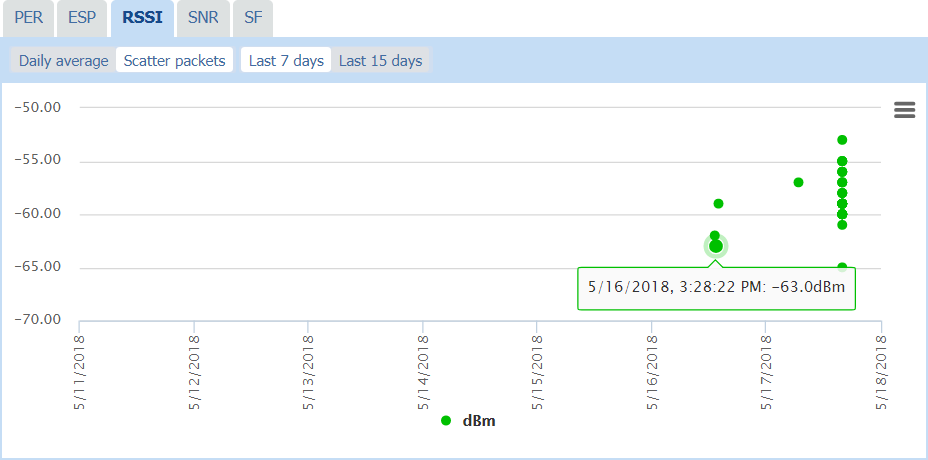
Click the RSSI tab, then:
-
Click Daily average and Last 7 days, or Last 15 days, to view:
-
The daily average RSSI of the device over the selected period for All LRRs. If available, you can select a specific LRR in the All LRRs list.
-
-
Click Scatter packets and Last 7 days, or Last 15 days, to view:
-
The device RSSI per packet over the selected period for all LRRs. If available, you can select a specific LRR in the All LRRs list.
-
-
-
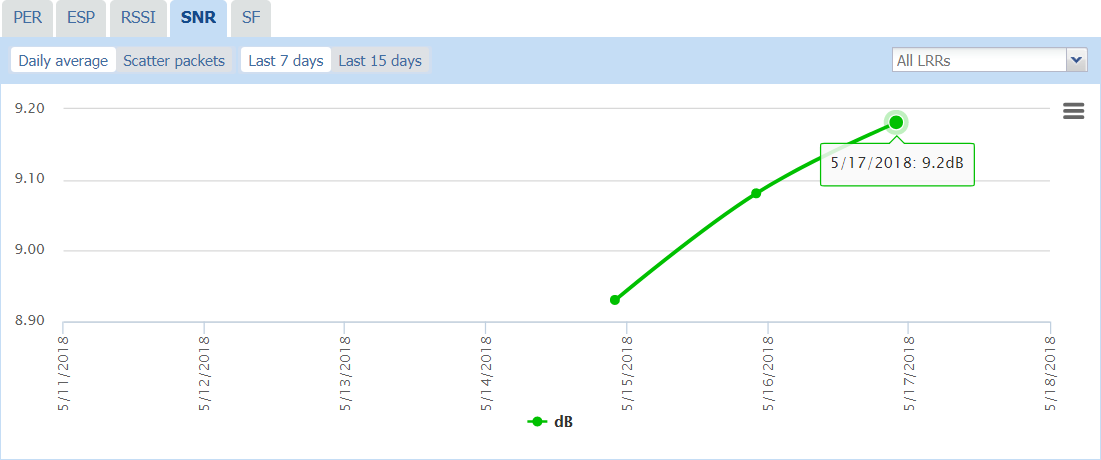
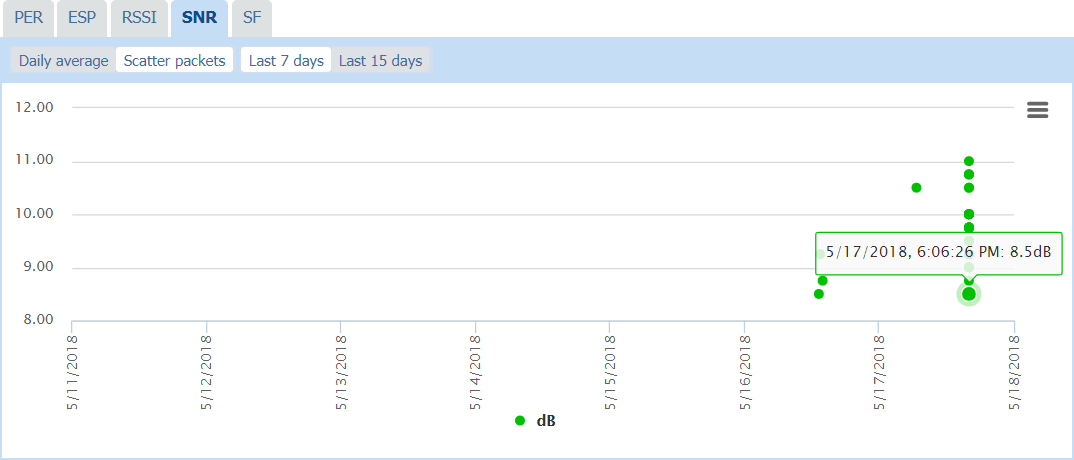
Click the SNR tab, then:
-
Click Daily average and Last 7 days, or Last 15 days, to view:
-
The daily average SNR of the device over the selected period for All LRRs. If available, you can select a specific LRR in the All LRRs list.
-
-
Click Scatter packets and Last 7 days, or Last 15 days, to view:
-
The device SNR per packet over the selected period for all LRRs. If available, you can select a specific LRR in the All LRRs list.
-
-
-
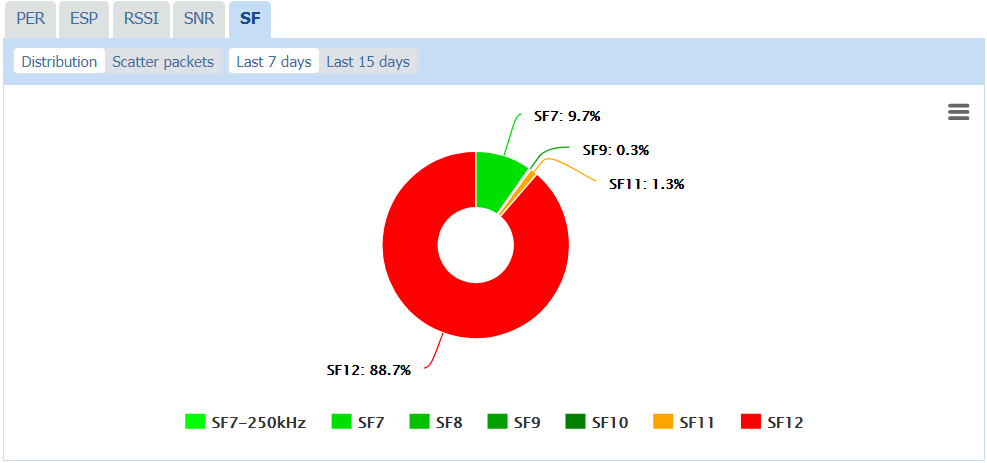
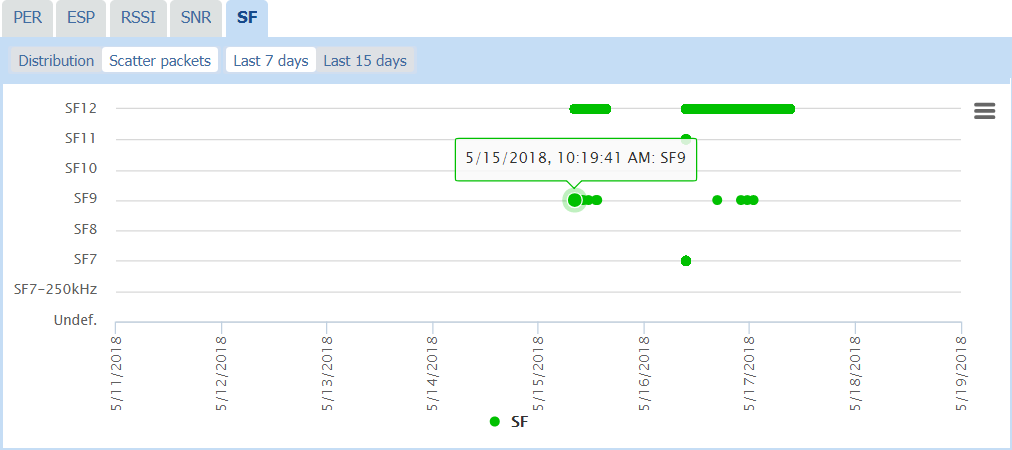
Click the SF tab, then:
-
Click Distribution and Last 7 days, or Last 15 days, to view:
-
The distribution of the spreading factors over the selected period.
-
-
Click Scatter packets and Last 7 days, or Last 15 days, to view:
-
The Spreading Factors used per packet over the selected period.
-
-
-
If you want to remove some information from the chart, click the corresponding item in the chart caption. It also adjusts the scale according to the information displayed.
-
If you want to print or download this chart, see Printing or downloading a chart.