Monitoring packets and payloads history of a LoRaWAN® device
You can display charts representing the device's packets and payloads to check the radio traffic history over a selected period, and help you monitor or troubleshoot a LoRaWAN® device.
Tips
-
Hovering your mouse over an item of the chart displays additional traffic information.
-
Clicking an item of the caption makes it appear or disappear from the chart and adjust the scale.
-
In the navigation panel, click Devices to display the Devices panel, then click the List or the Map tab.
-
Select the device you want to check the activity, and click View or Edit to enter the Device panel.
-
Scroll down the Device panel to display the Uplink/Downlink packets and Uplink/Downlink payloads tabs with the charts.
-
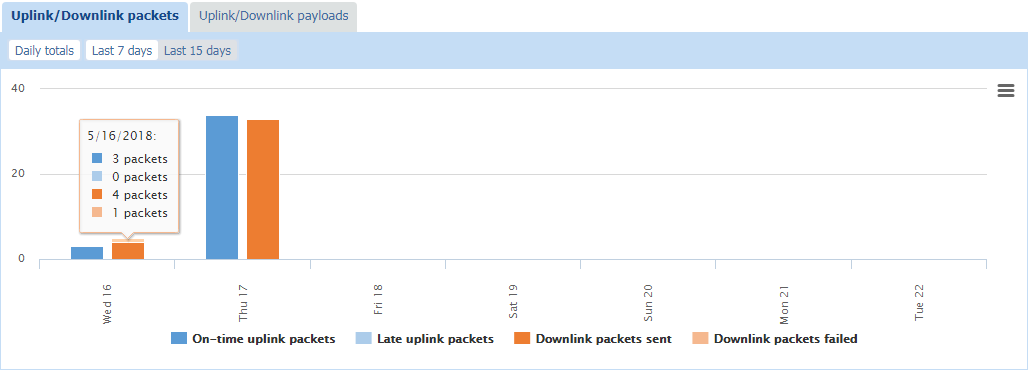
Click the Uplink/Downlink packets tab, then:
-
Click Daily totals and Last 7 days, or Last 15 days, to view over the selected period:
-
The total number of On-time uplink packets
-
The total number of Late uplink packets
-
The total number of Downlink packets sent
-
And the total number of Downlink packets failed.
Tip Hover your mouse over an item of the chart to read the exact number of packets with their distribution per day.
-
-
-
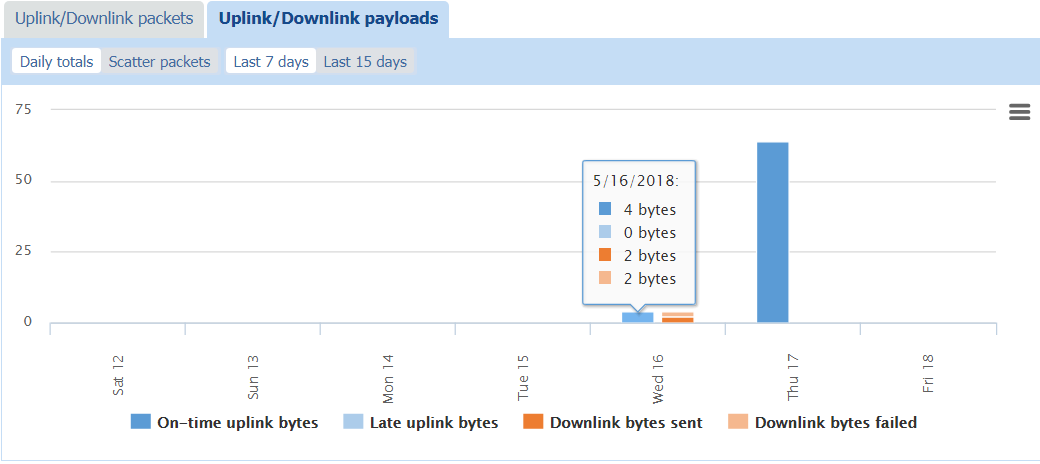
Click the Uplink/Downlink payloads tab, then:
-
Click Daily totals and Last 7 days, or Last 15 days, to view over the selected period:
-
The total size of On-time uplink bytes
-
The total size of Late uplink bytes
-
The total size of Downlink packets sent
-
And the total size of Downlink packets failed.
Tip Hover your mouse over an item of the chart to read the total size of bytes used with their distribution per day.
-
-
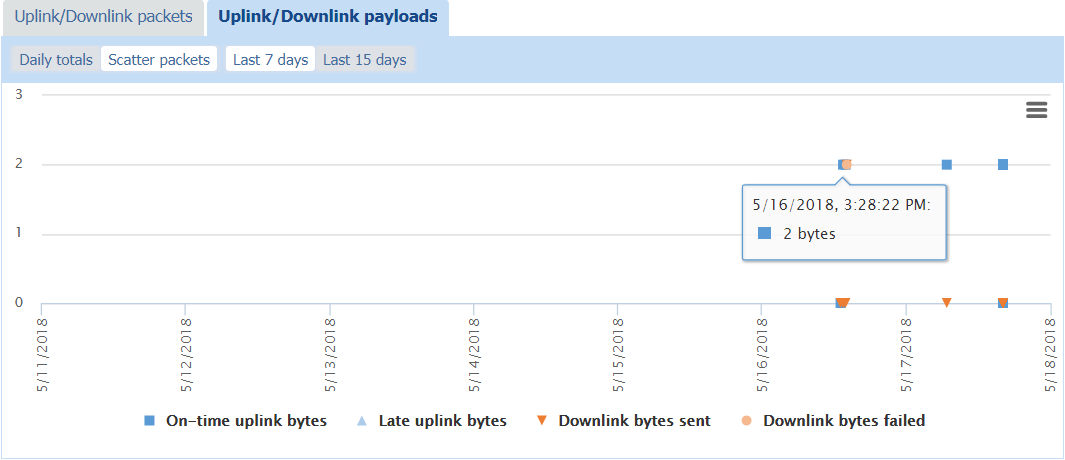
Click Scatter packets and Last 7 days, or Last 15 days, to view over the selected period the scattering of packets per day of:
-
On-time uplink bytes
-
Late uplink bytes
-
Downlink packets sent
-
and Downlink packets failed.
Tip Hover your mouse over a packet in the chart to see its timestamp and size in bytes.
-
-
-
If you want to remove some information from the chart, click the corresponding item in the chart caption. It also adjusts the scale according to the information displayed.
-
If you want to print or download this chart, see Printing or downloading a chart.