Administration procedures
Accessing the TPE instance with a console
The TPE instance can be accessed with a console by using ssh access or directly from Cockpit.
ssh support@${IP_OR_HOSTNAME_OF_TPE} -p 2222
Only the support user should be used to access the system.
Do not try to access or change the root password. Otherwise, all access to the system will be blocked.
Changing default keymap
The TPE terminal keyboard default setting is English.
The setting can be changed also with the following command:
To set French, for example:
localectl set-keymap fr
The list of available settings can be displayed as below:
localectl list-keymaps
Accessing Cockpit
Cockpit is accessed on the TPE instance with the credentials of the support account.
You need to tick the checkbox "Reuse my password for privileged tasks" to be able to perform administration tasks on Cockpit.
Updating parameters on Cockpit
Some configuration parameters may be updated on Cockpit after the installation.
However, this does not include the PKI certificate and key.
Other configuration parameters can be updated by applying the following procedure:
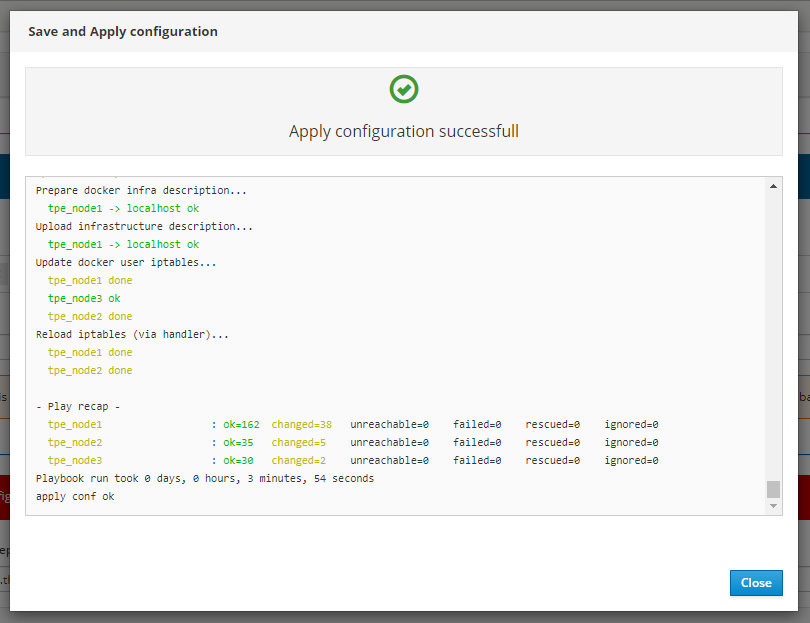
- Modify parameters in Cockpit.
- When you click Save & Apply, a confirmation popup is displayed and all changes are directly saved and applied. The restart of necessary TPE services is done automatically.
For more details about configuration parameters, see TPE configuration.
Listing containers/services and health check
Listing containers
From ssh console (this can be done as well on Cockpit using the Containers module):
$ docker ps
CONTAINER ID  ...   STATUS                   ...  NAMES
50766bc8d549  ...   Up 12 minutes (healthy)  ...  actility_twa.2.cx2h3fwn691det6krz96bw9sl
ed7cba4db759  ...   Up 13 minutes (healthy)  ...  actility_tpdx-hub.1.wjooh9esmob1deiiqi4ua1sbt
f82e7d1cf3ab  ...   Up 13 minutes            ...  actility_snmp-system.uyq6qer1zxysyc6vx7yyz0c8g.wo6kb5wss6pz9ta80ypcus2x3
96e437b0ffac  ...   Up 13 minutes            ...  actility_proxy-http.uyq6qer1zxysyc6vx7yyz0c8g.hqkii6oehxqxyl22asq3ayez4
83a8fe10dd46  ...   Up 13 minutes            ...  actility_tpdx-core.1.df06pb4qdbo668q5tw47ukhug
f86423c344b1  ...   Up 13 minutes            ...  actility_snmp-tpe.1.iu001lydddgsimvoll9n6ncd8
86a34b471c72  ...   Up 13 minutes            ...  actility_tpdx-bridge-5.1.babnostzak359n8qkz86nwqua
d6fd3f293254  ...   Up 14 minutes            ...  actility_support1.1.v3bhstynvn59xf21jgsvr63kw
dbc677ccd94b  ...   Up 14 minutes            ...  actility_tpdx-admin.1.hjwm479w69cwskc97gel0jdvz
8a829c777729  ...   Up 14 minutes            ...  actility_cron-rfscan1.1.tey8jcyevjxeq3iop0opvbjbw
484654265a24  ...   Up 14 minutes            ...  actility_spectrum-analysis.1.8kf92gmy98jvvsr6jjdudr8h7
d6e38230b2a4  ...   Up 13 minutes            ...  actility_ftp1.1.jxkvqw5wxnc8m9h8d4pw91x92
269a2b86f53b  ...   Up 14 minutes            ...  actility_shellinabox.1.fa9dof9lp72ms5wn0x0chvnjb
1bd65a105006  ...   Up 14 minutes            ...  actility_tpdx-bridge-3.1.ucaaw48ez2xpqfyh1srkerxrd
ab9de08629d8  ...   Up 14 minutes            ...  actility_twa-ran.1.aaa50x1aejmvc134bgqxmo5qj
2ba07eb120bb  ...   Up 14 minutes (healthy)  ...  actility_lrc1.1.0p1g86tauueqlw7ykppko3efs
3547b62359d0  ...   Up 16 minutes (healthy)  ...  actility_sql_node1.1.dojmnthklk0bsh97ff4cvahup
95b6705e880e  ...   Up 18 hours              ...  actility_twa-dev-task-fc.2.z69fzjzgjmku8lyfnr1rszum9
5f1abd35c852  ...   Up 18 hours              ...  actility_twa-task-res.2.vn0jgqfoxqpsvw655ehdhk5yp
03b2f7d2b151  ...   Up 18 hours              ...  actility_traefik.uyq6qer1zxysyc6vx7yyz0c8g.rstf37e3o9d3j15ba72bbifdx
b903d9e05532  ...   Up 18 hours              ...  actility_lrc-sync1.1.mieza6zj58p48ar2v7e3y0es1
d8b8310ce8bd  ...   Up 18 hours (healthy)    ...  actility_kafka_node1.1.5a43py1nog5iybwkxrg6smlps
750111459bcb  ...   Up 18 hours (healthy)    ...  actility_mongo_node1.1.bfcp3rsbjwp60u3w2yn7fn790
3eb528ef56ca  ...   Up 18 hours (healthy)    ...  actility_zk_node1.1.m5lhg865lw2rrn5p6c0tq8n7d
ca052a596c9e  ...   Up 3 days                ...  tpe-slrc
acbc762e0019  ...   Up 3 days                ...  registry.uyq6qer1zxysyc6vx7yyz0c8g.bmapltso3s1c2nmqj1kxiljk7
All containers should be up and running. If not, try to redeploy the TPE services. For that, go to the TPE Configuration Cockpit module and click on "Save & Apply".
Listing services
From ssh console:
$ docker service ls
ID                  NAME                         MODE                REPLICAS    ...   PORTS
6gi8prljcgpo        actility_backup-sidecar1     replicated          0/0         ...
g7wj0fx3sdny        actility_backup-sidecar2     replicated          0/0         ...
iiksfmskilxw        actility_cron                replicated          1/1         ...
nxax6ftb2hj9        actility_cron-rfscan1        replicated          1/1         ...
23ohk1hb8j7o        actility_cron-rfscan2        replicated          1/1         ...
27d6rs8pjagt        actility_ftp1                replicated          1/1         ...   *:21->21/tcp, *:10000-10100->10000-10100/tcp
ih1jl6g3olb4        actility_ftp2                replicated          1/1         ...   *:2121->21/tcp, *:10200-10300->10200-10300/tcp
as68wgltea1f        actility_kafka_node1         replicated          1/1         ...
ovoou845wtfr        actility_kafka_node2         replicated          1/1         ...
fogofojolga0        actility_kafka_node3         replicated          1/1         ...
qdlirro0w7n6        actility_lrc1                replicated          1/1         ...   *:2404->2404/tcp
6ci72ai6obh9        actility_lrc2                replicated          1/1         ...   *:2405->2404/tcp
ik2584fgqh7g        actility_lrc-sync1           replicated          1/1         ...
meauxs6l4y1e        actility_lrc-sync2           replicated          1/1         ...
rlzkm4y31t02        actility_mongo_node1         replicated          1/1         ...
tk48bmuxrozb        actility_mongo_node2         replicated          1/1         ...
lj2u8q9uhpcb        actility_mongo_node3         replicated          1/1         ...
bqo0gwc7rlb3        actility_mongo_operator      replicated          0/0         ...
y0i1lwbpxuu0        actility_monitor             replicated          1/1         ...
xbe4usb0e4e2        actility_network-survey      replicated          1/1         ...
84gru0eis5i1        actility_proxy-http          global              3/3         ...
h1v0a8vb54ng        actility_rca                 replicated          2/2         ...   *:8080->8080/tcp
zh5flfofa3i7        actility_rca_operator        replicated          0/0         ...
3vh10a2rtqf3        actility_shellinabox         replicated          1/1         ...
4femixwmfa6z        actility_slrc-companion1     replicated          0/1         ...
r7dshu8djt0p        actility_slrc-companion2     replicated          0/1         ...
s6kc89w2y7as        actility_smp-tpe             replicated          2/2         ...
z7c17vqmeq0j        actility_snmp-system         global              3/3         ...
ahtf7wft7xsx        actility_snmp-tpe            replicated          1/1         ...   *:13161->13161/udp
qb4vs7g5zc4u        actility_spectrum-analysis   replicated          1/1         ...
hydkoxv4nova        actility_sql-proxy           replicated          2/2         ...
hx57ne4jrknb        actility_sql_node1           replicated          1/1         ...
8h97hgf9hann        actility_sql_node2           replicated          1/1         ...
f9ky48qt4dl8        actility_sql_node3           replicated          1/1         ...
6dekyiwnied8        actility_support1            replicated          1/1         ...   *:22->22/tcp
xurltz5swl67        actility_support2            replicated          1/1         ...   *:2224->22/tcp
rafny2ryoqrf        actility_task-notif-ws       replicated          2/2         ...
jxl7n3gilrd3        actility_tpdx-admin          replicated          2/2         ...
lb9wblk8ijrt        actility_tpdx-bridge-1       replicated          1/1         ...
ufvx5frwm1b0        actility_tpdx-bridge-2       replicated          1/1         ...
bd1egc3qe703        actility_tpdx-bridge-3       replicated          1/1         ...
crsbqli1fbiq        actility_tpdx-bridge-4       replicated          1/1         ...
4gxqqiw6xot5        actility_tpdx-bridge-5       replicated          1/1         ...
umee9ly3zgkl        actility_tpdx-core           replicated          2/2         ...
xyxik7s49ypp        actility_tpdx-hub            replicated          2/2         ...
y08xjumt41i8        actility_traefik             global              3/3         ...
5hy114uccxl7        actility_twa                 replicated          2/2         ...
ubr76pzbrcge        actility_twa-admin           replicated          2/2         ...
skf6rv1277ew        actility_twa-dev             replicated          2/2         ...
whxsehi9exvg        actility_twa-dev-task-fc     replicated          2/2         ...
iacjnhzlp1di        actility_twa-ran             replicated          2/2         ...
ink5trvdtdkp        actility_twa-task-res        replicated          2/2         ...
onhsqc2dheci        actility_wlogger             replicated          2/2         ...
x4nq8hq5kyhd        actility_zk_node1            replicated          1/1         ...
mbmvglq0gie5        actility_zk_node2            replicated          1/1         ...
2zupgn97atzf        actility_zk_node3            replicated          1/1         ...
k592ro2ml7xg        registry                     global              3/3         ...
From the Cockpit:

Most of the services should be up and running. If not, try to redeploy the TPE services. For that go to the TPE Configuration Cockpit module and click on "Save & Apply".
Some services are started only to do some specific action (like backup) and are stopped when the action is done. Below is the list of the services that could be stopped without any functional impact:
- backup-sidecar
- mongo_operator
- rca_operator
- slrc_companion
Some other services are started only following the features activated on the TPE Configuration Cockpit module:
- If "DX API" feature is disabled, the following service is stopped: tpdx-core.
- If "IoT Flow" feature is disabled, the following services are stopped: tpx-flow-hub, tpx-flow-bridge, tpx-flow-api and tpx-flow-supervisor.
- If "DX API" and "IoT Flow" features are disabled, the following services are stopped: tpdx-core, tpdx-admin, tpx-flow-hub, tpx-flow-bridge, tpx-flow-api and tpx-flow-supervisor.
- If "Node-RED" feature is disabled, the following service is stopped: node-red.
- If "IPsec (X.509) for base station to TPE connection" is disabled, the following services are stopped: rca and slrc.
Connecting to a container
To connect to a container from Cockpit or ssh console by using the container name, for example for lrc:
docker exec -it $(docker ps -q -f "name=actility_lrc1") bash
By using container id (id can be retrieved by executing the docker ps
command):
docker exec -it qdlirro0w7n6 bash
Displaying container logs
To display the logs of a container by using the container name, for lrc:
docker logs $(docker ps -q -f "name=actility_lrc1")
By using container id:
docker logs qdlirro0w7n6
Displaying service logs
To display the logs of a service, for lrc:
- From ssh console:
docker service logs actility_lrc1
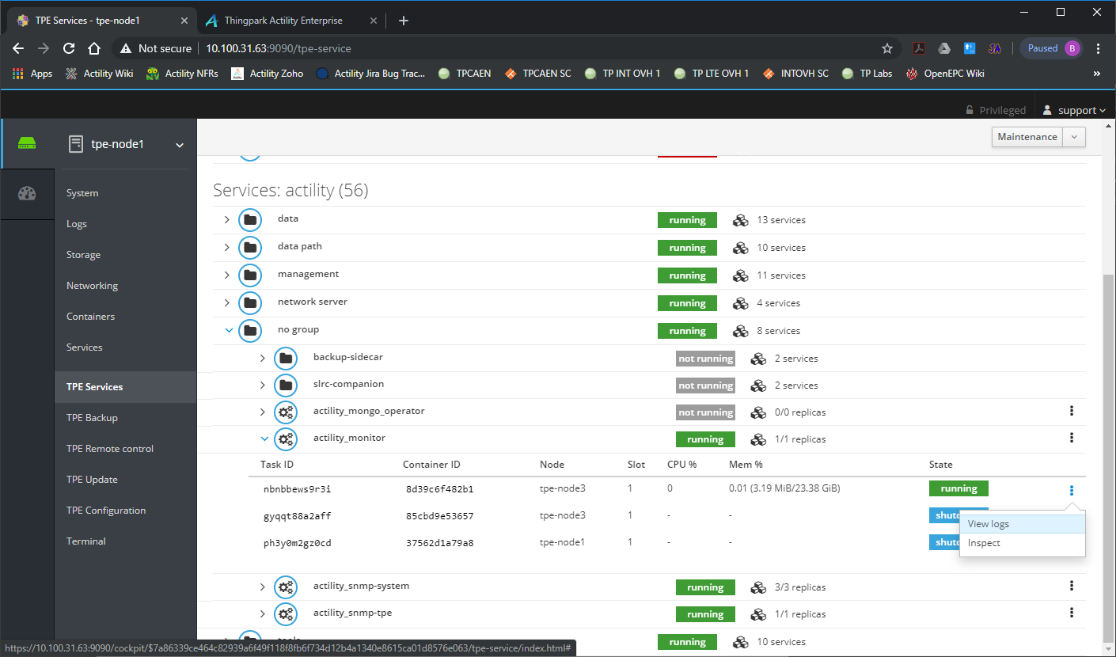
- From Cockpit, click on "View logs":

Stopping and starting infra containers
To stop and start an infra container, for slrc:
- From ssh console:
cd /home/tpepilot/wordir/actility
docker-compose kill slrc
docker-compose up -d slrc
- From Cockpit, click on "Restart":
Stopping and starting a replicated service
To stop a replicated service, for lrc:
docker service scale actility_lrc1=0
To start a replicated service with one replica, for lrc:
docker service scale actility_lrc1=1
To start a replicated service with 2 replicas, for rca:
docker service scale actility_rca=2
When you start the service, take care to set the right replica number.
Stopping and starting a global service
To stop a global service, for proxy-http:
docker service rm actility_proxy-http
To start a global service:
cd /home/tpepilot/workdir
docker stack deploy -c docker-compose-services.yml actility
Stopping and starting chronyd
To stop the chronyd service (time synchronization):
systemctl stop chronyd
To start the chronyd service:
systemctl start chronyd
Redeploying a service from Cockpit
To redeploy a global or replicated service from Cockpit, click on Redeploy. For the kafka service on node1:
Redeploying the TPE cluster from Cockpit
To redeploy the entire TPE cluster, typically after a node recovery in High Availability (HA) mode or when the Upgrade to HA has failed, from Cockpit do a Redeploy cluster:

Checking access to the Repository
To check the access from the TPE server to the TPE repository, run the following command on the terminal:
wget https://InstallationID:InstallationID@repository.thingpark.com/tpe-rpm/repodata/repomd.xml
If an error is raised, check the proxy configuration.
If the problem persists, contact your support.
Monitoring services on Cockpit
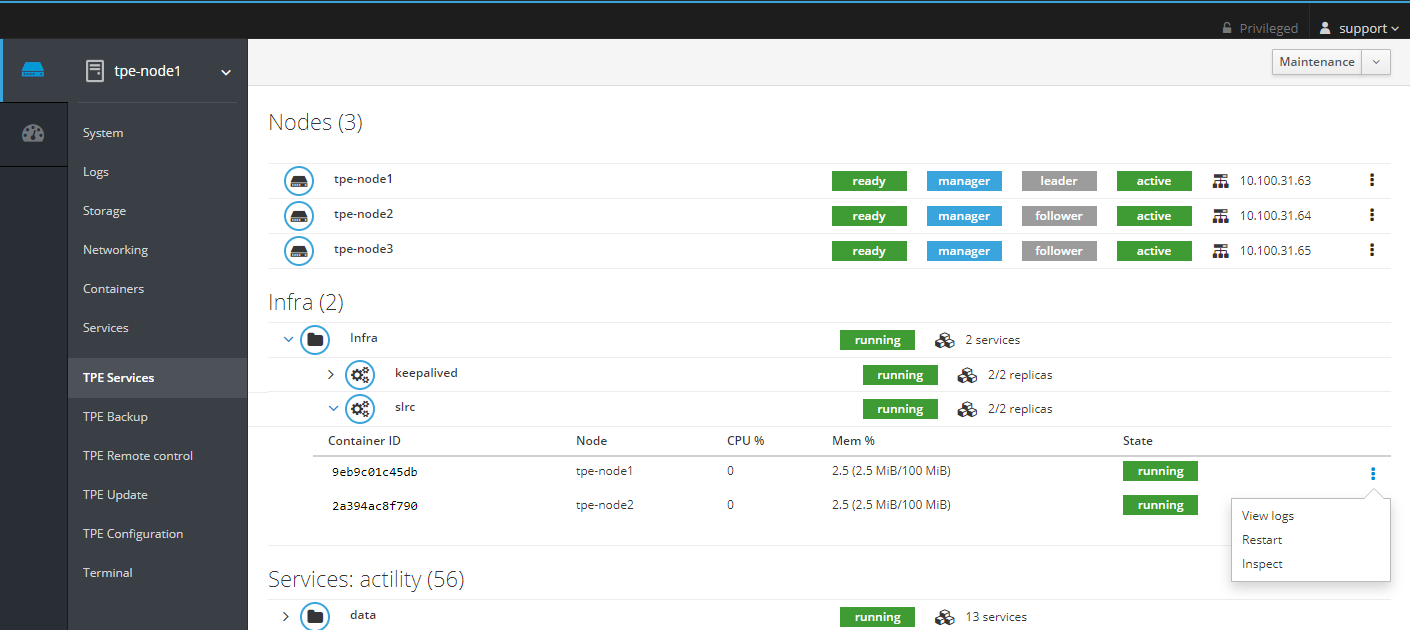
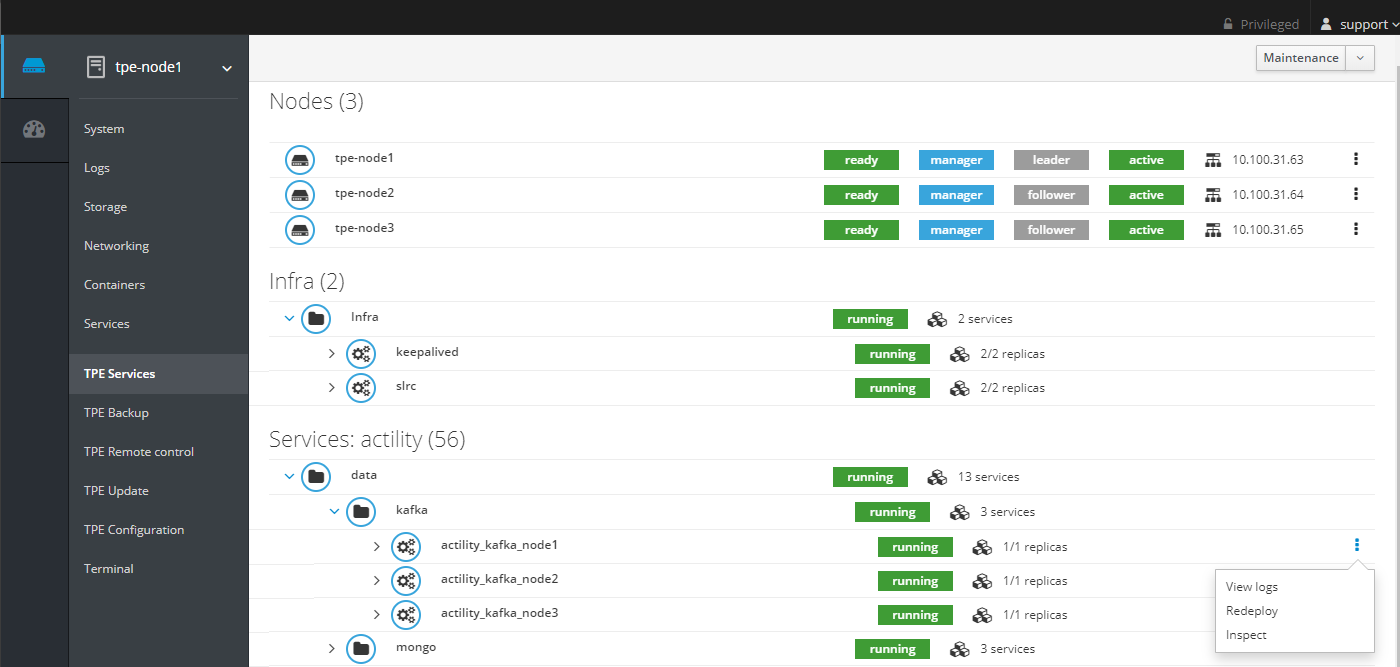
CPU usage, Memory usage and state can be checked for all containers/services on the TPE Services Cockpit module.
If any abnormal activity (100% CPU on a container, container restarting in loop, etc...) is detected, do the following:
- Restart the service.
- If the situation does not go back to normal, contact your support.
The system health can be checked using the logs of the service actility_monitor on Cockpit.
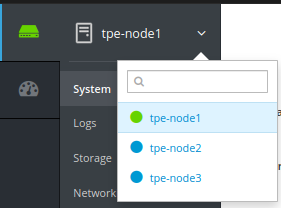
The color code of the nodes menu (screenshot below) is not associated with the state
of the host, but only provides information about where the session is
connected.
SNMP monitoring
ThingPark Enterprise offers two levels of monitoring:
- System monitoring,
- Services monitoring.
Both are accessible through SNMP v2 on the support community. Only
explicitly configured IP addresses can retrieve information.
IP addresses allowed to access SNMP are configured separately for system and services monitoring:
- in the infrastructure configuration for system monitoring
- in the TPE Configuration for services monitoring
An SNMP client with the appropriate MIB is required to retrieve monitoring information. MIB retrieval is detailed in the following sections.
System monitoring
System monitoring exposes ThingPark Enterprise node metrics supported by Net-SNMP 5.7 agent. See README.agent-mibs for the list of exposed tables and objects.
The SNMP agent listens on port 161 of each ThingPark Enterprise node.
In case of High Availability (HA) deployment, each ThingPark Enterprise node must be supervised independently.
Example
NET-SNMP client and MIBs installation (on Ubuntu/Debian)
sudo apt install snmp snmp-mibs-downloader
sudo sed -i 's/mibs :/# mibs :/g' /etc/snmp/snmp.conf
Run one of the following commands to retrieve:
- CPU load
snmptable -v 2c -c support <node-ip-address> UCD-SNMP-MIB::laTable
- CPU statistics
snmpwalk -v 2c -c support <node-ip-address> UCD-SNMP-MIB::systemStats
- Memory usage
snmpwalk -v 2c -c support <node-ip-address> Memory
- Disk usage
snmptable -v 2c -c support <node-ip-address> UCD-SNMP-MIB:dskTable
- Disk IO
snmptable -v 2c -c support <node-ip-address> UCD-DISKIO-MIB::diskIOTable
- Network traffic
snmptable -v 2c -c support <node-ip-address> IF-MIB::ifTable
Services monitoring
Services monitoring exposes the status (up or down) of the Network
server. A custom MIB is used:
iso.org.dod.internet.private.enterprise.actility.thingpark.thingparkEnterpriseMIB.thingparkEnterpriseServices.
The two files ACTILITY-MIB.my
and THINGPARK-ENTERPRISE-MIB.my
must be provided to your SNMP client. For example, if you are using NET-SNMP,
place these files in the .snmp/mibs directory in your home and tell
NET-SNMP to load them by adding the following line in the
.snmp/snmp.conf file:
mibs +ACTILITY-MIB:THINGPARK-ENTERPRISE-MIB
The SNMP agent listens on port 13161 of each ThingPark Enterprise node.
Example
$ snmptable -v 2c -c support <tpe-address>:13161 THINGPARK-ENTERPRISE-MIB::thingparkEnterpriseServiceTable

SNMP table: THINGPARK-ENTERPRISE-MIB::thingparkEnterpriseServiceTable

 thingparkEnterpriseServiceName thingparkEnterpriseServiceStatus
                    OSS Service                               up
                Network Service                               up
Remote connection
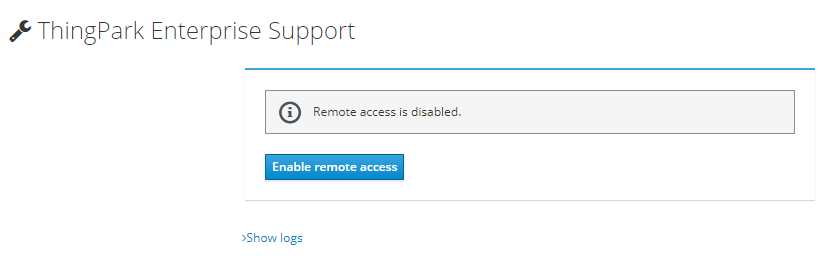
The TPE system administrator can activate remote access to the TPE server for Actility Level 3 Support by following the steps below:
-
Ensure the Level 3 remote access server is set to
tpe-ocp@tpe-remote-support.actility.com:443/home/tpe-ocp/remote-socketsin the infrastructure configuration. -
In the TPE Support Cockpit module click the "Enable remote access" button.
-
As soon as the tunnels are opened, the TPE system administrator must communicate the three displayed parameters to the support team:
- Session ID
- Password
- TPE hostname
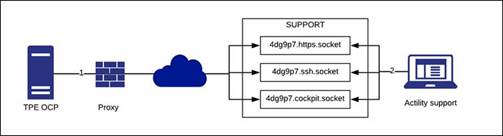
Once the remote access is enabled, the connection between TPE and Actility support service is established as follows:
Rescue user
If you have lost your credential to connect to ThingPark Enterprise GUI, on the TPE Support Cockpit module click "Enable rescue user":

Once enabled, a credential to connect to ThingPark Enterprise GUI is displayed:
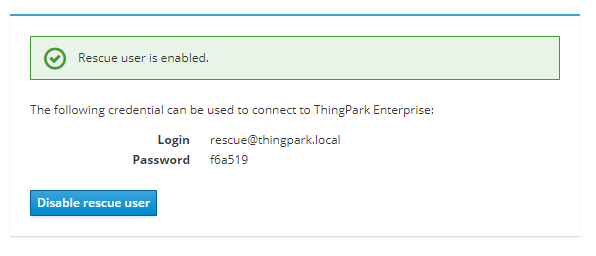
Use this credential to connect to the GUI, you can then access to User Accounts page to modify your own password. When done disable the rescue user on the TPE Support Cockpit module.
TEX synchronization
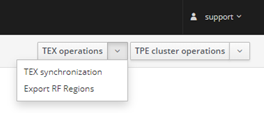
TEX synchronization status with LRC can be monitored in "TPE Services" under the menu "TEX operations -> TEX synchronization":
When clicking on TEX synchronization the following window is displayed showing the current TEX synchronization status:
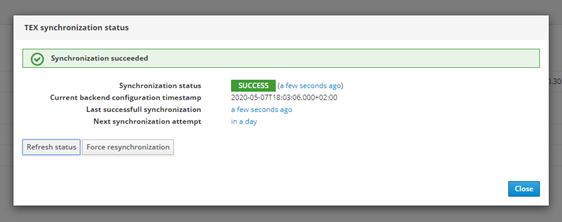
TEX synchronization is done automatically every day but it can be forced by clicking on Force resynchronization. You can also force a refresh of the TEX synchronization status by clicking on Refresh status.
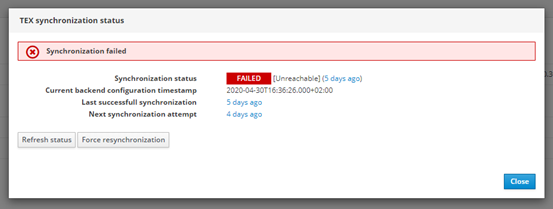
If TEX synchronization does not work, the following status is displayed:
You can also export the RF Regions from the menu "TEX operations -> Export RF Regions". This allows to download a tgz file containing all RF Regions matching the configured ISM band(s).
Post-upgrade procedure
The post-upgrade procedure consists in a set of post-upgrade requests that migrates automatically the SQL and MongoDB data after an upgrade of the TPE instance. The status of the post-upgrade procedure can be checked in the TPE Services Cockpit module under "others" service. The status of post-upgrade service can be:
- running: the post-upgrade procedure is currently running and not yet finished.
- complete: the post-upgrade procedure is completed with success.
- failed: the post-upgrade procedure is completed with error(s).
You can access the logs of the post-upgrade procedure service through the kebab menu of the service by clicking on "View logs".
You can also check the post-upgrade requests state by running the script tpe-post-upgrade-status
on the TPE host:
$ tpe-post-upgrade-status
2022/07/18 16:31:51: INFO: Start tpe-post-upgrade-status script
2 entrie(s)
uid: 2
     creationTimestamp: '2022-06-23T13:50:33.000Z'
     scope: 'ALL'
     serviceID: 'TWA'
     requestID: 'RDTP-7689-bs-certificate-migration'
     requestPath: '/thingpark/wireless/rest/systems/demons/migrateBsSecurity'
     requestBody: '{ "max" : 10 }'
     state: 'PROCESSED'
     stateTimestamp: '2022-06-27T14:05:11.000Z'
     lastResponse: '{"status":200,"message":"OK","data":{"countOnly":false,"max":10,"result":{"done":6,"remaining":0}}}'
     errorCounter: 0
     iterationCounter: 5
uid: 4
     creationTimestamp: '2022-06-23T13:50:33.000Z'
     scope: 'TPE-OCP'
     serviceID: 'TWA'
     requestID: 'RDTP-18480-alarm-email-notification-migration-for-tpe-ocp'
     requestPath: '/thingpark/wireless/rest/systems/demons/migrateUserAlarmNotifications'
     requestBody: '{ "max" : 100 }'
     state: 'PARTIALLY_PROCESSED'
     stateTimestamp: '2022-06-27T14:14:11.000Z'
     lastResponse: '{"status":250,"message":"Unknown","data":{"operatorID":null,"max":100,"countOnly":false,"result":{"done":0,"remaining":2}}}'
     errorCounter: 0
     iterationCounter: 2
The script displays the list of post-upgrade requests and for each request, the details of the request, including the processing state. The processing state of a post-upgrade request can be:
INIT: the post-upgrade request has been added and must be processed.IN_PROGRESS: an HTTP POST is in progress for this request.PARTIALLY_PROCESSED: other iterations are needed to complete the post-upgrade request.TRANSIENT_ERROR: the last HTTP POST failed and must be retried.ABORTED: the post-upgrade manager was not able to complete the post-upgrade request.PROCESSED: the post-upgrade request is fully completed.SKIPPED: the post-upgrade request was never applied on this system (because the procedure was flagged DEPRECATED or because the scope does not apply to this PF).
If for some reason you want to execute the post-upgrade procedure again, for example when it failed, you can do it through the TPE Services Cockpit module by clicking on "Redeploy" under the kebab menu.
Changing hardware configuration
If you update the hardware configuration of your TPE instance (for instance if you change your TPE Hardware profile), you must explicitly update the TPE configuration:
- Connect to Cockpit
- Go to the TPE Configuration module
- Click on "Apply & Save" to apply the new configuration.
Regenerate IPsec certificates for base station traffic
To regenerate the IPSec certificates of all base stations, run the following procedure:
-
Execute an ssh command to connect to the TPE node:
ssh support@${IP_OR_HOSTNAME_OF_TPE} -p 2222 -
Then run the following script to regenerate the certificates:
/usr/bin/tpe-regenerate-bs-certificates