Interface overview
Viewing the traffic
You can have an overview of the traffic going through your LoRaWAN® network by displaying up to 10 000 packets in the Dashboard.
Only legitimate packets (with a verified Message Integrity Code, MIC)
are visible in Wireless Logger.
Any illegitimate uplink message that
is discarded by the network server (for instance, due to a wrong MIC
or because of replay attack detection) is not displayed.
In most situations, such illegitimate packets trigger alarms at device level.
To learn more, see Device alarms.
The Dashboard contains a search bar and a result window called the Last packets list. To learn more about filtering options in the search bar, see Filtering packets.
In the Last packets list:
- The list starts with the most recent packets. It can have up to 100 pages and 1 page can contain 100 packets.
- The most important metadata of the packets is displayed in columns to help you perform a quick analysis and detect issues. Metadata is a series of information related to the transmission or reception of the packet.
For more information, see Uplink metadata columns and Downlink metadata columns.
In page 1 of the Last Packets list, the last 100 packets related to your devices (according to your search criteria) are displayed. The ID displayed at the top of the user interface (between brackets, after "Dashboard") refers to the subscription's ID.
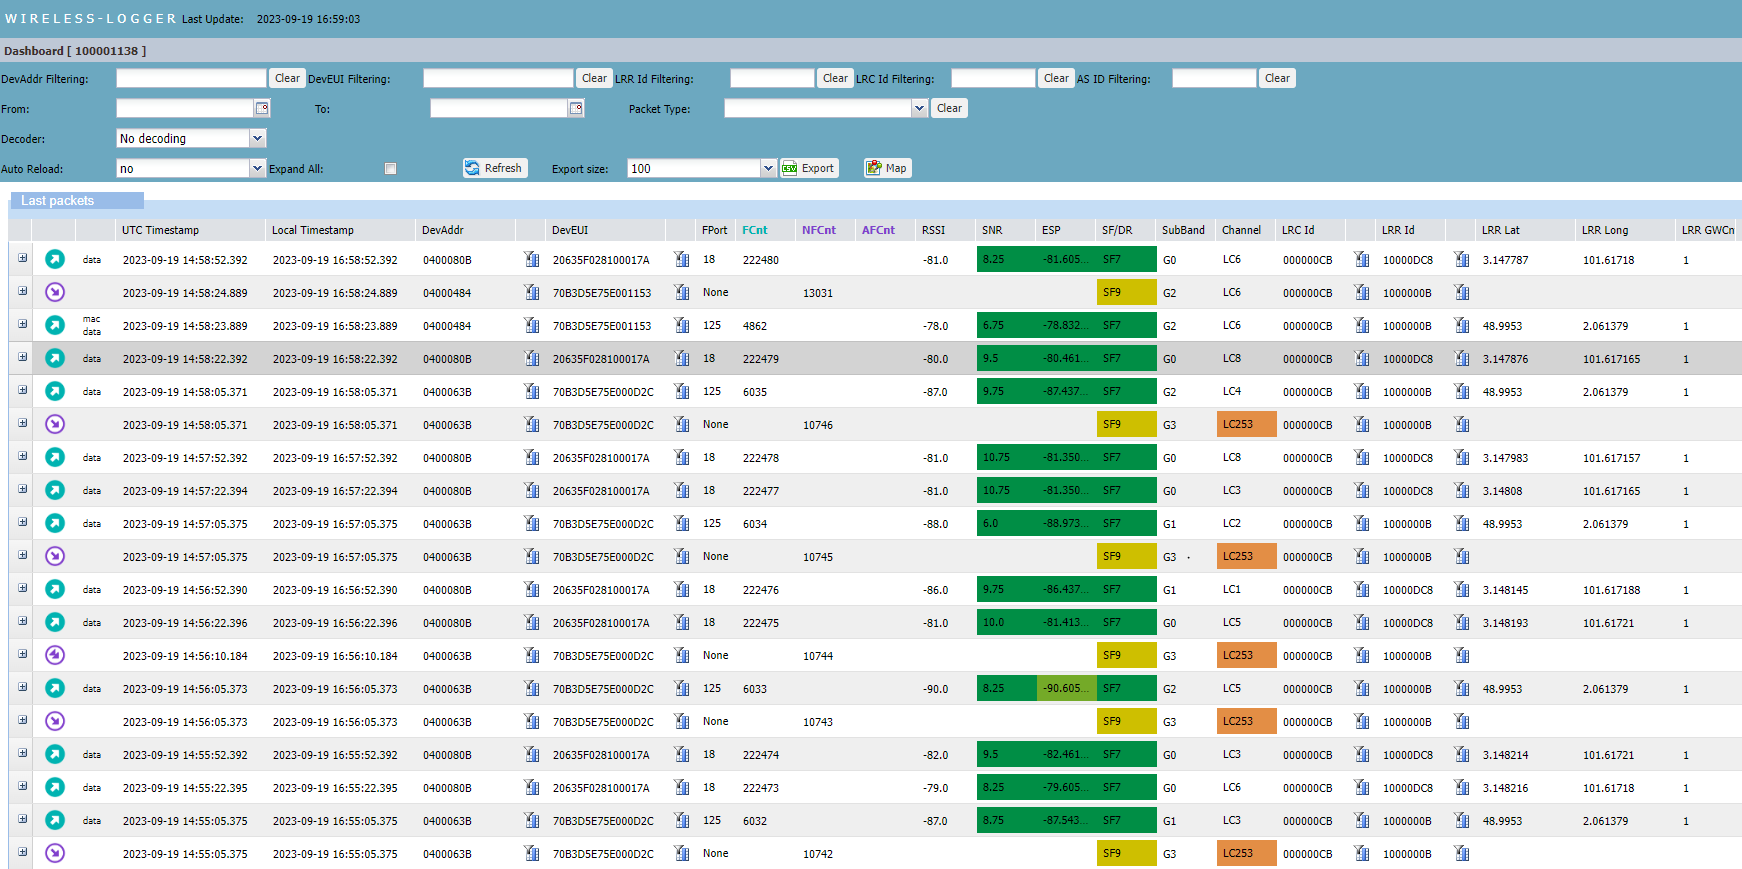
Check the radio metrics highlighted by specific colors. For more information, see Radio color codes and LoRaWAN® radio statistics .
To reload the packets, click the Refresh button anytime you want. Alternatively, use the Auto reload option in the search area to always get the latest packets. The reload periodicity is can be configured from 10 seconds up to 120 seconds.

IF your ThingPark Enterprise subscription has been partitioned by the administrator into multiple tenants, thanks to the domains feature, AND you are a non-admin user having domain restrictions, THEN:
- you will only see the LoRaWAN traffic related to devices, base stations and multicast groups that match your own domain restrictions. To learn more, see Managing domains.
- Only the history of the LoRaWAN traffic related to a resource (device, base station or multicast group) after its association to the user's domain(s) becomes visible in Wireless Logger.
Extending the dashboard
To see more packets on your screen, you can extend the Last packets list by collapsing the search bar. You can also extend the search bar when needed.
-
In the Dashboard line above the search bar, click

-
To extend the search bar again, click
.
Expanding packets
Expanding packets allows you to display all the packet's metadata as well as its payload.
- Packet metadata is a series of attributes related to the transmission or reception of the packet. The most important metadata is displayed in the columns of the collapsed view of the packet. To learn more about the metadata associated with each packet type, see the detailed LoRaWAN traffic description.
- For uplink & downlink packets carrying data payloads, the expanded view allows you to see the MAC commands (in decoded format) and the applicative payload. The applicative payload contains the application data of the packet. It is a hexadecimal aggregation of several digital data sent or received by the device. For uplink packets, the applicative payload contains data such as temperature, GPS position, or battery level.
Expanding a packet
You can expand a packet to display all its metadata. You can also collapse it.
-
In the Last packets list, click
 on the left side of a packet.
-> The expandable panel of the packet opens.
-
To collapse the packet, click
 .
.
Expanding all packets
You can switch between a collapsed and an expanded view of all the packets of the Last packets list. It applies to all the pages of the list.
-
In the search bar, select the Expand All check box.

-> All packets of the list open.
-
To switch back to the collapsed view, clear the Expand All check box.
-> All packets of the list close.
Displaying decoded data payloads
When the device in question belongs to your account, the packet content including the
applicative payload is displayed in the expandable panel of the packet.
To open it, click ![]() on the left side of a
packet to display the MAC and/or applicative payload inside.
on the left side of a
packet to display the MAC and/or applicative payload inside.
- By default, the data payload is displayed in raw hexadecimal format, while MAC commands are displayed in decoded format.
- You can decode and display all LoRaWAN® payloads included in the current page of the Last packets list, if the corresponding decoders are known to Wireless Logger. A LoRaWAN® payload decoder deserializes the payload and extracts meaningful data values to display the payload with the application data.
The payload content may be hidden, for sake of confidentiality, in the following cases:
- The reporting of applicative payload to ThingPark OSS subsystems (TWA/WLogger) has been disabled by the operator.
- In roaming-in use cases (fNS passive roaming), when the packet belongs to a foreign device and is simply forwarded by your network server (acting as fNS) to your peer roaming partner.
- The current permissions provided to you by your administrator allow you to view the LoRaWAN traffic flowing through your base stations without having the right to access the underlying devices. This may happen when the ThingPark platform is partitioned via administrative domains.
Since LoRaWAN® payloads are exchanged in encrypted format over the air, the decoding of applicative payloads in Wireless Logger is only possible if ThingPark has access to the payload in decrypted format. This implies that:
-
For ABP devices: The AppSKey must be provisioned in ThingPark by the subscriber.
-
For OTA devices: The AppKey must be provisioned in ThingPark by the subscriber. Note OTA devices using end-to-end payload encryption mode with a Hardware Security Module (HSM) cannot have their LoRaWAN® applicative payloads decoded in Wireless Logger.
To display decoded data payloads for uplink and downlink packets, choose
Automatic in the Decoder list of the search area, then
click ![]() .
.

In Automatic mode, the right decoder is automatically identified for each device based on the driver metadata associated with the device profile. When Automatic is selected, the decoded data is also included in the export file, along with information about the driver. For more information, see LoRaWAN® export file.
Locating on map
Locating base stations that received a given packet
Using the map, you can visually display the position of the LRR base stations that received a specific uplink packet. This allows you to visually locate the approximate position of the device and get more information.
-
Click Localize LRRs and device on a map
 to
display all LRR base stations that have received this packet.
to
display all LRR base stations that have received this packet.
-
Hover your mouse over a packet to display more information.

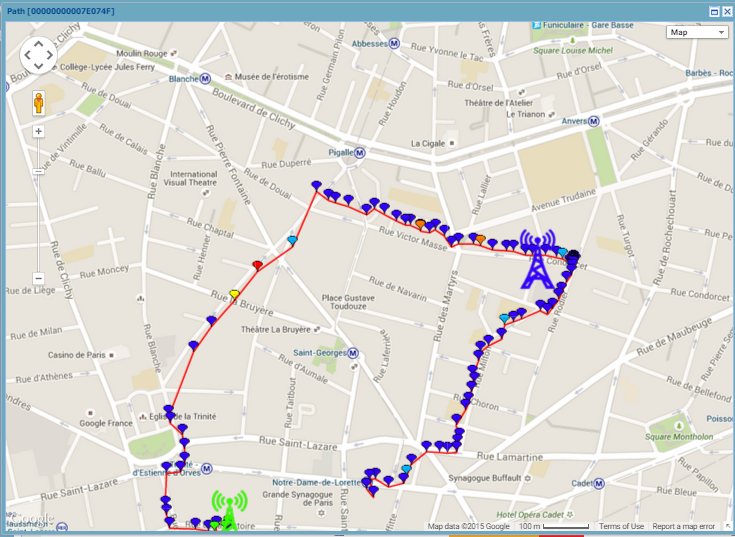
Displaying the device trip
You can display the trip of a device on a map.
- Click Draw location path
 on the
right side of a packet.
on the
right side of a packet.
-> The result displays all packets from the device that are available in the logger result.