Viewing the last 25 Uplink/Downlink packets of a connection
-
Click Connections and the name of the connection for which you want to check the last 25 Uplink/Downlink packets that are sent from/to the device.
-
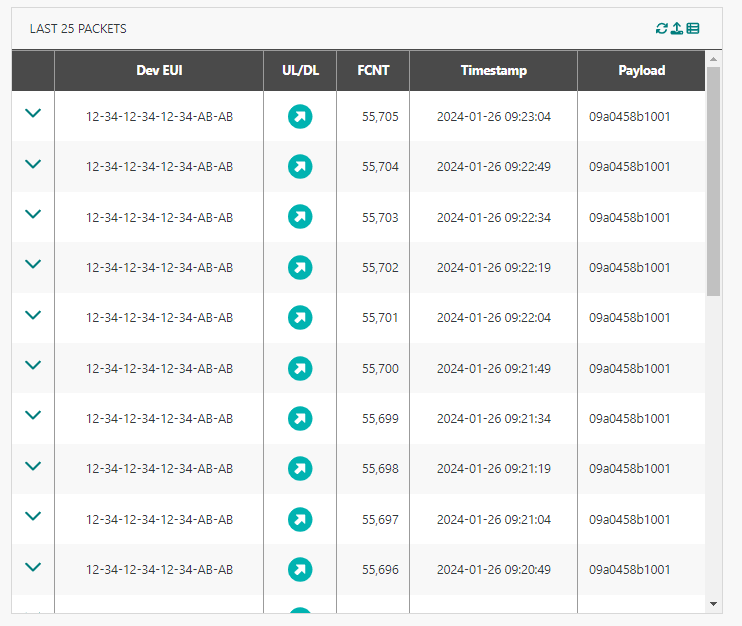
The last 25 packets frame is presented as in the following example.
noteIf your ThingPark Enterprise subscription is partitioned via administrative domains, non-Administrator users can only view the traffic data limited to devices matching their domain restrictions.
-
In the UL/DL column, you can see a graphical representation of the packet type and the packet content.
To learn more, see Uplink LoRaWAN® packets, Downlink LoRaWAN@ unicast packets and Downlink LoRaWAN@ multicast packets.
For "Basic HTTPS" connections, the Delivery to application column displays the transmission status of uplinks reports sent to the Application Server:
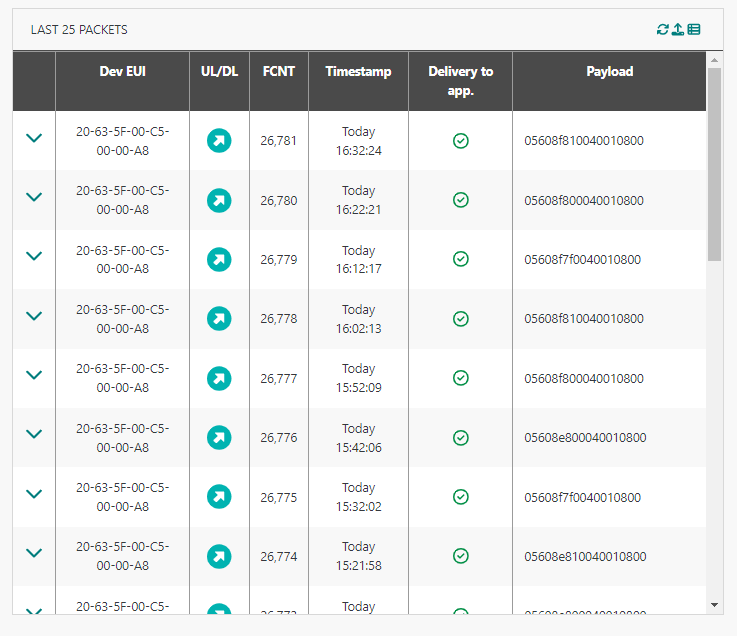
There are three types of statuses:
| Status | Explanation |
|---|---|
| Successful delivery to the application server. | |
| Failed delivery. Error details are displayed in the expandable zone of the uplink: - Timeout: The uplink was not successfully acknowledged by the destination within the expected timeframe, - Error: The uplink was rejected by the destination. (HTTP error, network error, DNS error), - Overload: The uplink was not sent to the destination because the network server reached the OVERLOAD state and the destination's average round trip time is too high, - Blacklist: The uplink was not sent to the destination because the network server reached the BLACKLIST state and the destination's average round trip time is high, - Unreachable: The uplink was not sent to the destination because this destination was deemed unreachable due to irresponsive behavior over the last observation window. | |
| Not applicable. The delivery to application column only displays delivery status for uplinks. |