Displaying RSSI percentile – All frequencies
This representation allows computing/plotting the RSSI level corresponding to a specific percentile of the whole distribution. For example, to compute the median RSSI value for all frequencies, the user shall set the Percentile to 50%; this computation allows displaying the data without the extreme RSSI values.
Another example, a percentile set to 95% shows the RSSI level for 95% of the samples, thus excluding the 5% of the high RSSI values.
To set the percentile value, select it with the scrollbar as displayed in the following screen.
![]()
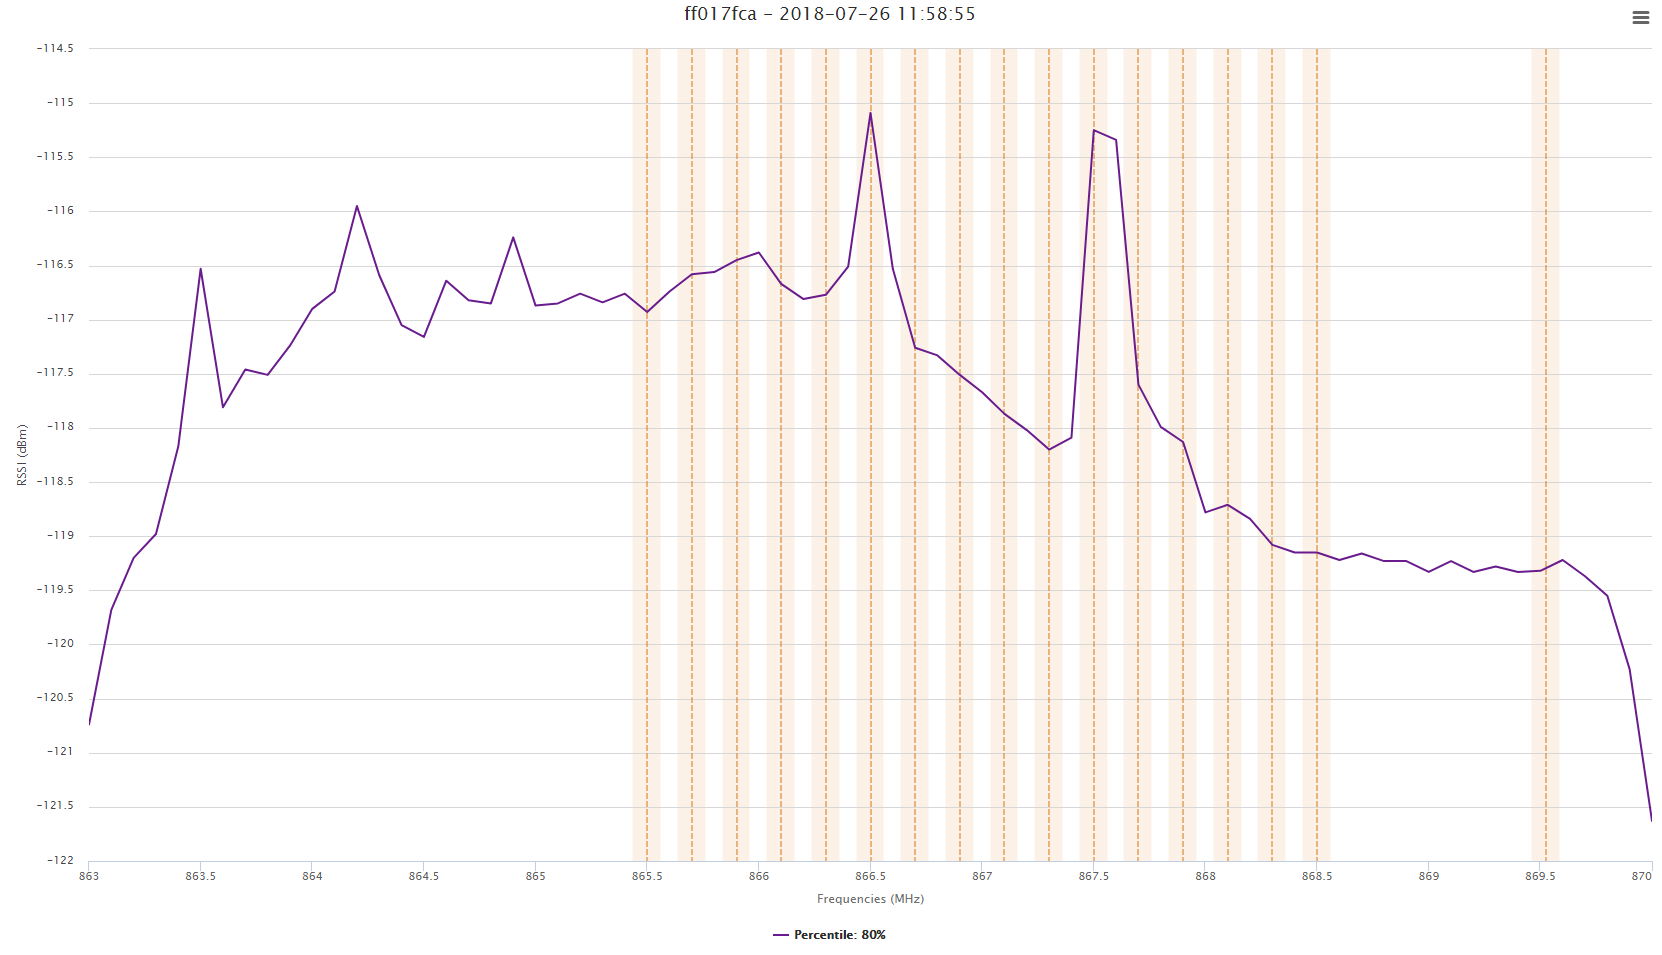
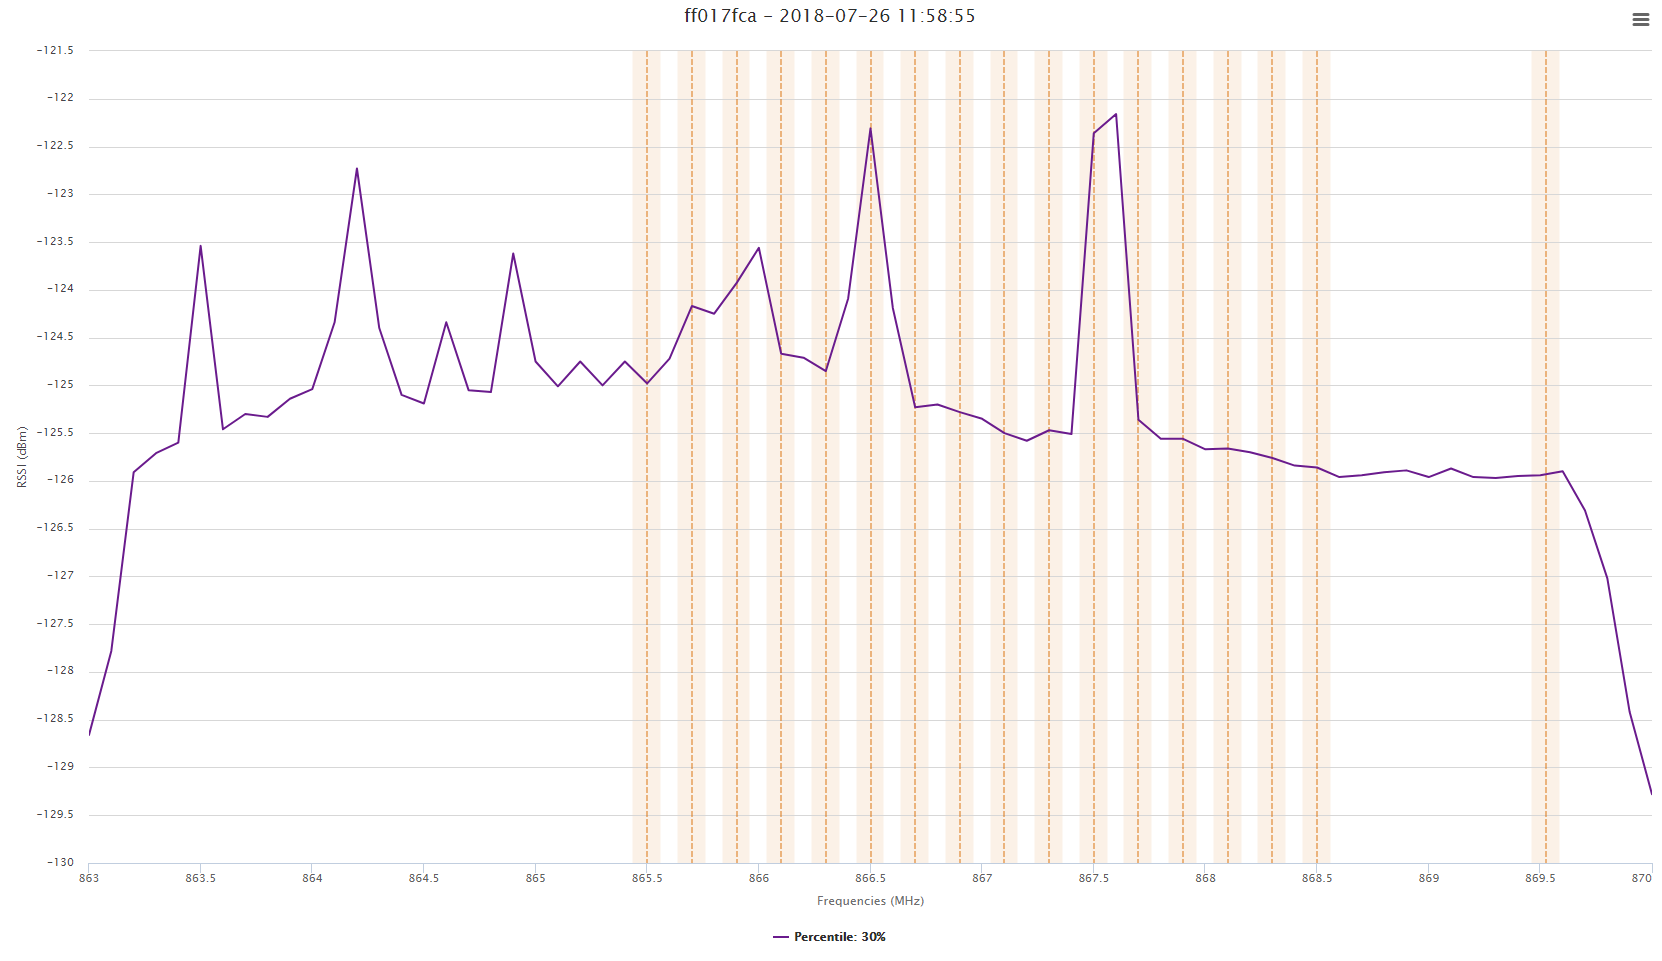
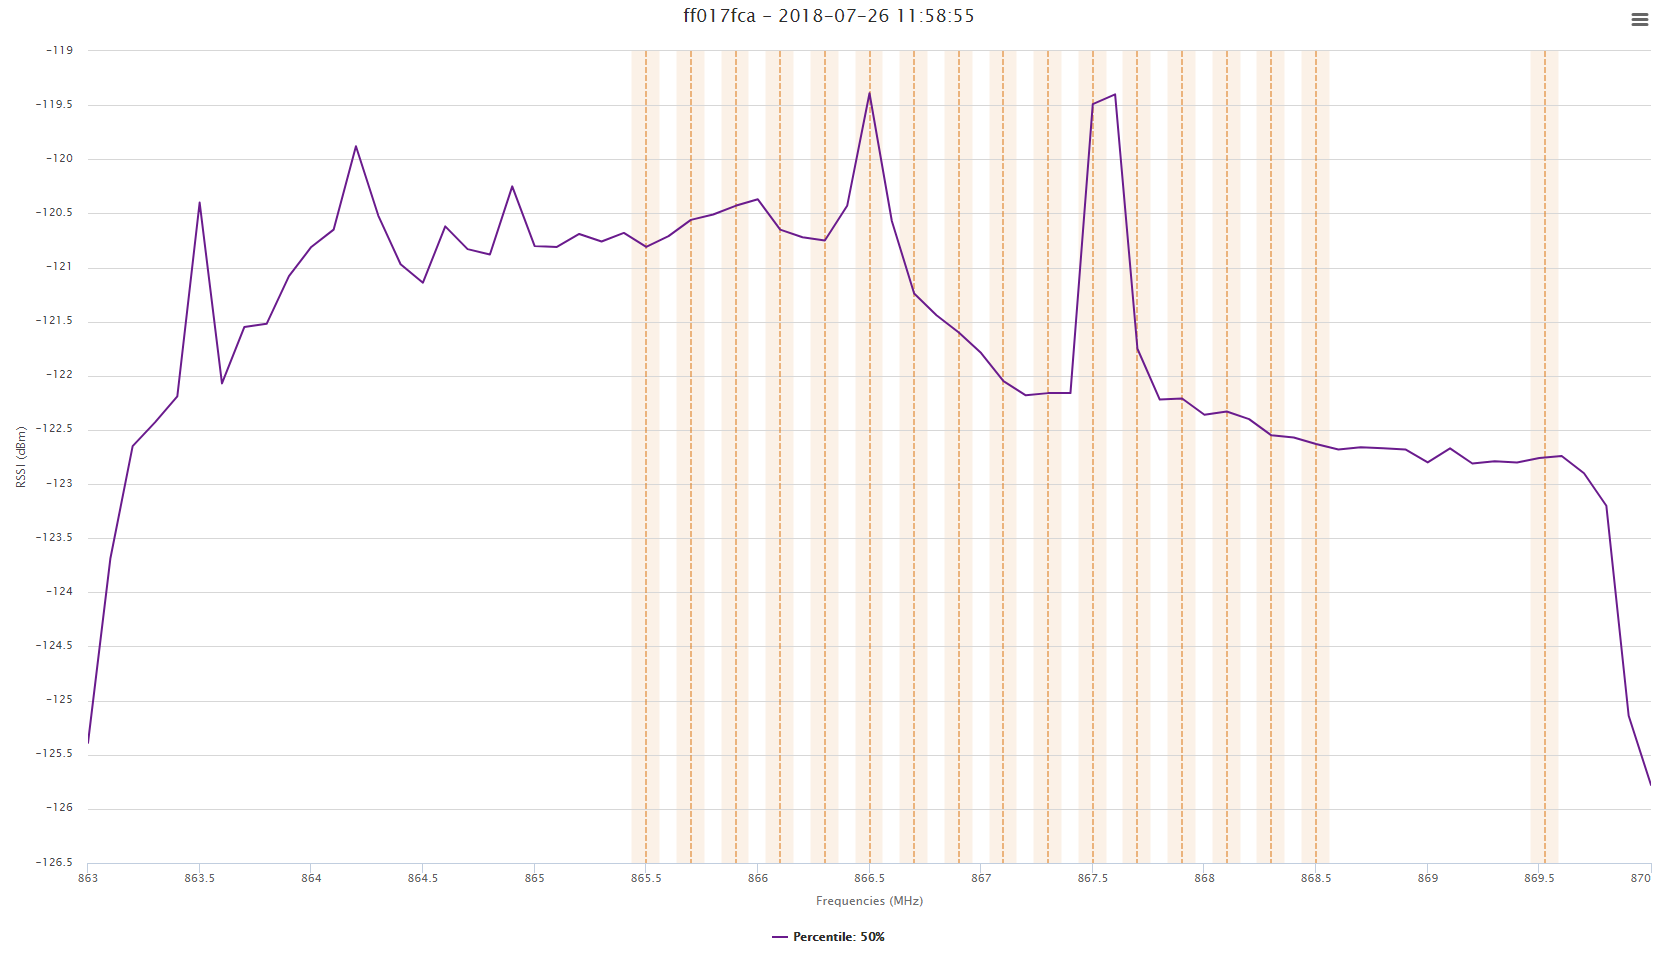
Relevant percentiles values include: 30%, 50%, and 80%:
Graph with percentile value at 30%:
Graph with percentile value at 50%:
Graph with percentile value at 80%: