Displaying logarithmic average
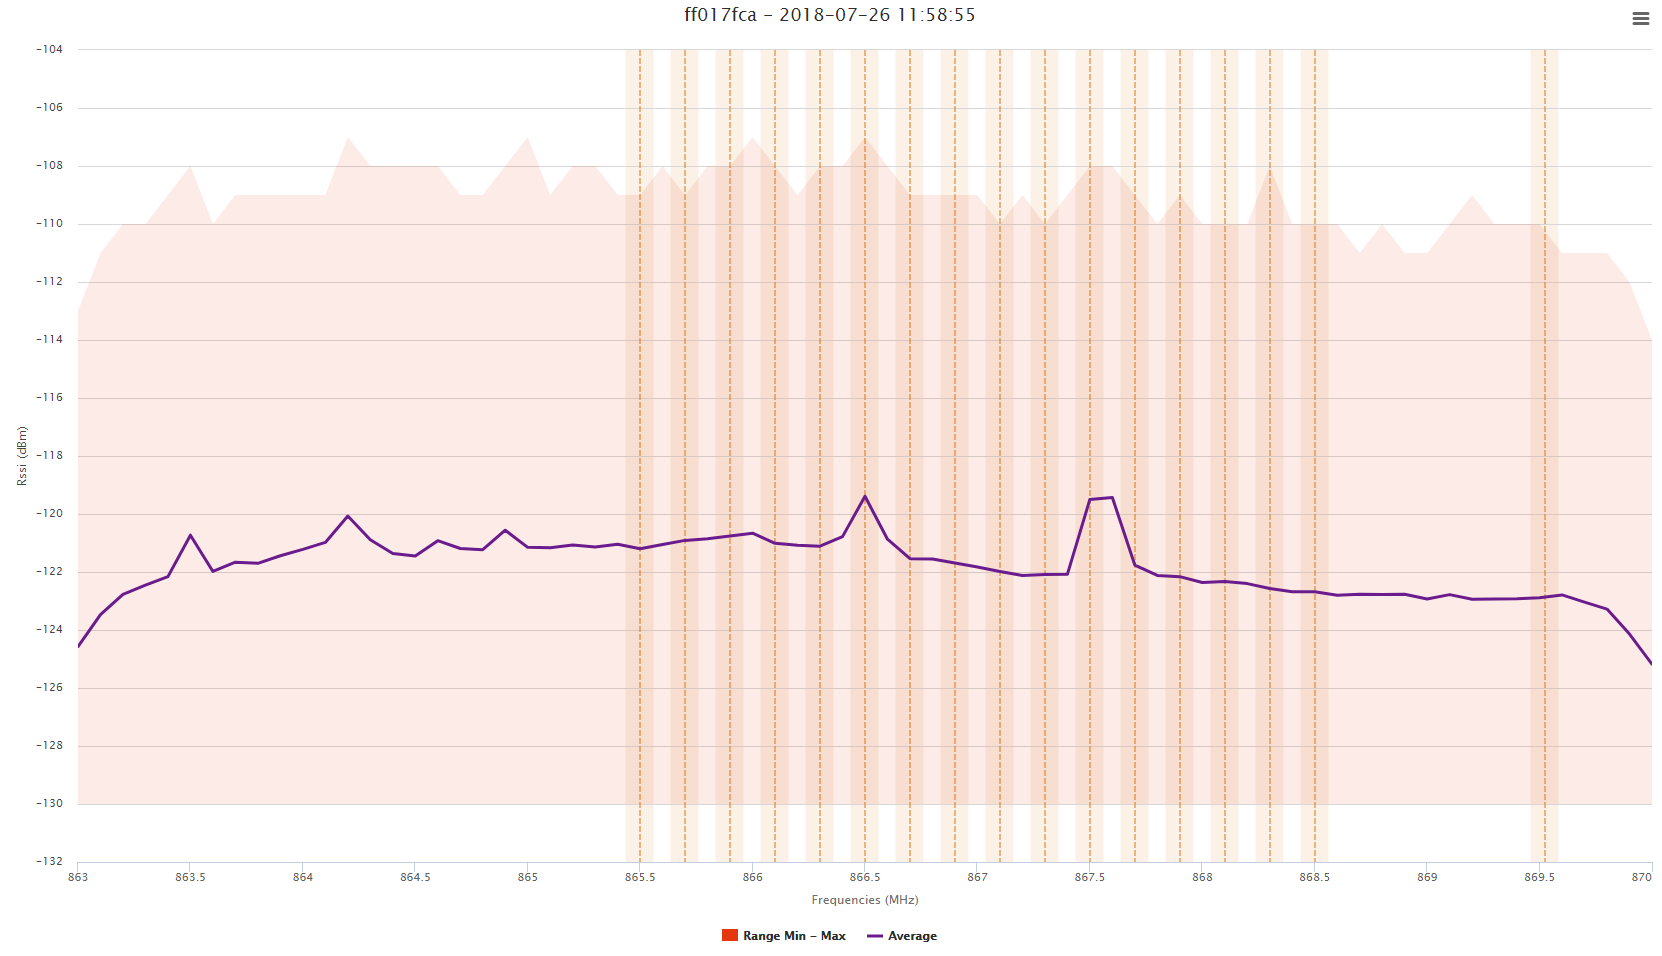
The logarithmic average computation is the direct average of all the RSSI values obtained for one frequency range, as the values are in dBm.
The impact of extreme values is limited with this method, but it is hard to detect sporadic interferers with high power level.
The min and max RSSI values obtained for each frequency range are also displayed.
Select Compute standard deviation if standard deviation values are needed, the graph will then show a purple zone representing the average RSSI +/- standard deviation.
