
Default dashboard

After logging in to the ThingPark Enterprise platform, you access the default dashboard.
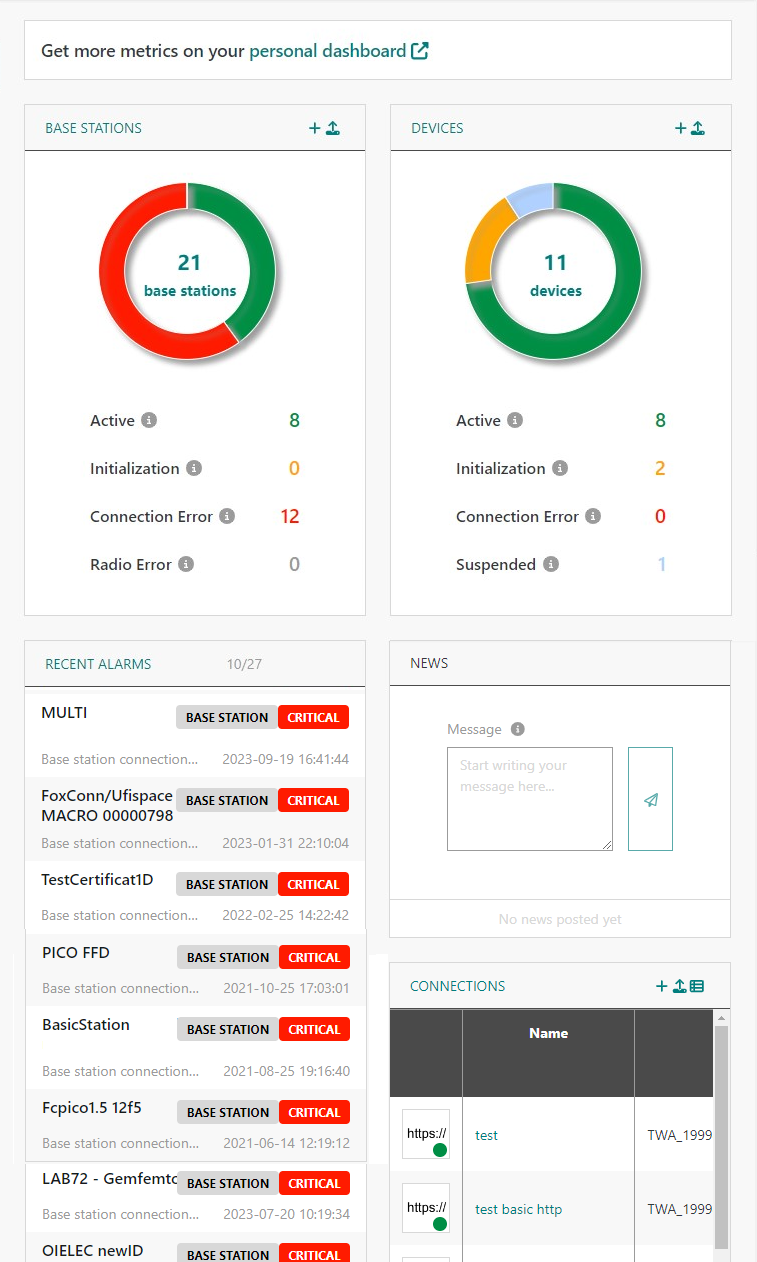
It looks like this:

If you are not entitled to an Administrator role, then you can view the News widget only if there is a message. The message can neither be modified, nor deleted.

For a full description of user management, see user roles.

The default dashboard is structured in four sub-areas.

Sub-areaDescription

Base Station

  • This pie-chart displays the status of base stations. Clicking one of the sectors of the pie chart takes you to the corresponding Base Station’s list.

Devices

  • This pie-chart displays the status of devices. Clicking one of the sectors of the pie-chart takes you to the corresponding device’s list.

Connections

  • This table lists the provisioned connections and the number of devices that are associated to each connection.

  • Click a line to go to the connection management or click the title to see the complete list.

News

  • In this widget you can share messages with other users of the system.

  • Clicking the paper airplane posts your update to the news list.

  • Clicking the trash symbol deletes your edit (after confirmation).

  • The widget is refreshed after update or delete.

  • All users may post and share news messages.

Recent Alarms

  • The area where you can view recent alarms.

  • Note Only the top 10 alarms having the highest severity are visible on the dashboard (that is to say, critical alarms, then major and then minor alarms).

  • Clicking the widget takes you to Alarms Management.

note

The widget on the top of the dashboard page redirects you to your personal dashboard. The dashboard is available only in SaaS mode.

It allows you to view all uplink/downlink activities of your IoT network that you want to monitor. You can configure each widget of the dashboard by clicking on the header icon of the widget.