Checking the device history
This page describes how to view the history of the last packets exchanged between the device and the network; as well as the location history of your device if it is geolocated by ThingPark.
Viewing the packet history
You can see the history of the last 10 uplink/downlink packets exchanged between the device and the network from the detailed page of each device. Additionally, you can see the decoded payloads of your application data in this same view.
Moreover, the Last MAC commands tab of the Packet history widget allows you to easily
troubleshoot the LoRaWAN configuration of your devices, by accessing the list of the last 10 MAC commands
even if they are not part of the most recent LoRaWAN packets exchanged between the device and the network.
These MAC commands are displayed in decoded format.
MAC commands older than the maximum traffic retention
period are not displayed. The default traffic retention period is 35
days for SaaS and 15 days for self-hosted deployments.
The list is ordered by descending timestamp, latest packets are displayed on top.
The list may be empty if the device has not exchanged any packets with ThingPark over the past days.
-
From the left pane, select Devices, then search for the device you want to view or edit.
-
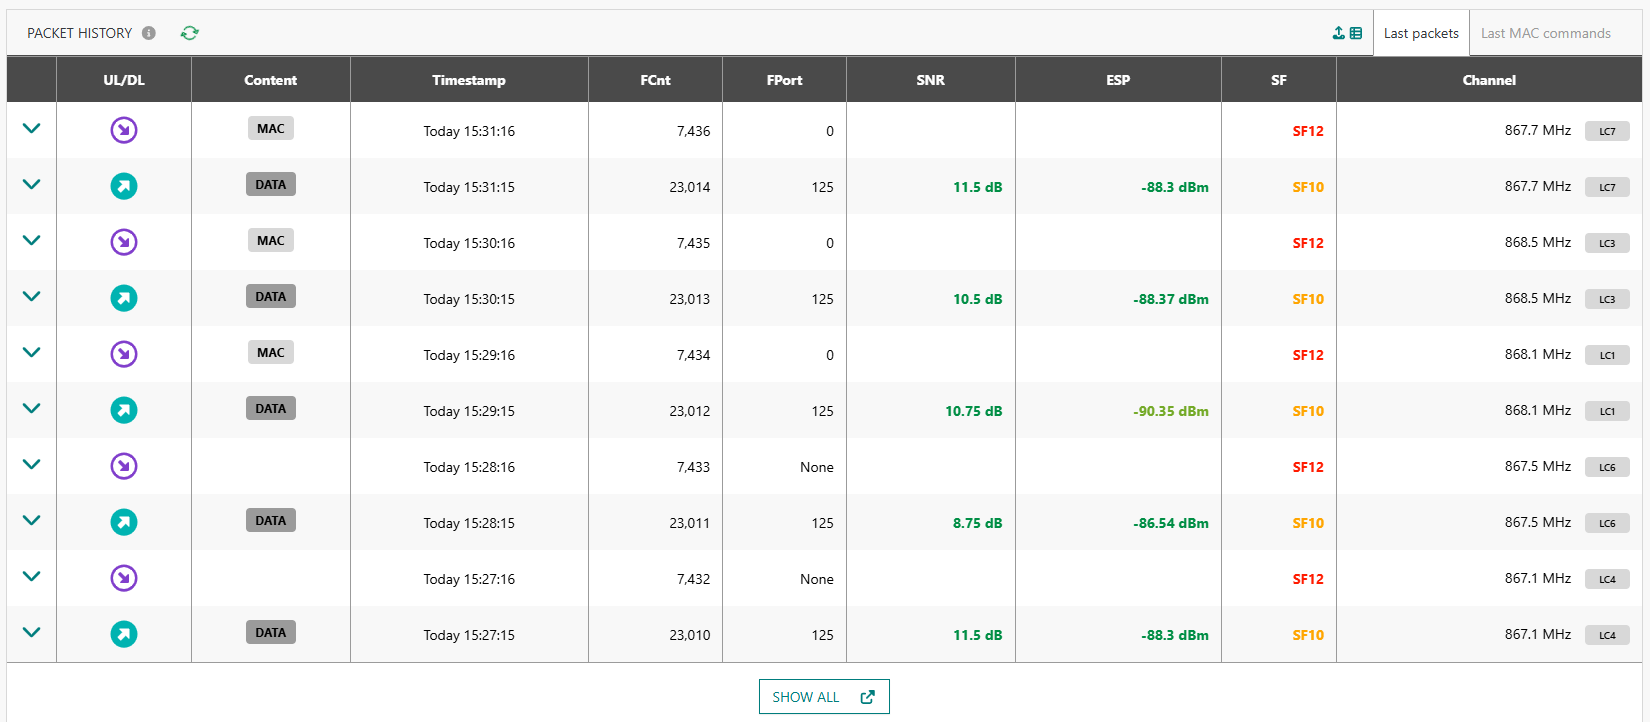
Go to PACKET HISTORY.
-> The last 10 uplink/downlink frame sequence is displayed as per the following example:
 tip
tipThis widget supports live updates with auto-refresh every 10 seconds, removing the need for manual refresh. To avoid disturbing the display when the user unfolds a row for details, the live update is paused if any row is expanded; then it gets automatically resumed once all the rows are collapsed.
-
In the UL/DL and Content columns, you can see a graphical representation of the packet type and content. Hover your mouse on each badge to get more details on the displayed value. To learn more, see Uplink LoRaWAN® packets and Downlink LoRaWAN® unicast packets.
To learn more about RSSI, SNR, and ESP, see LoRaWAN radio metrics. The related color codes are described here.
-
You may select which columns are displayed or hidden, by clicking the
 button at the
top-right corner of the widget. To export the list, click
button at the
top-right corner of the widget. To export the list, click  .
. -
Click
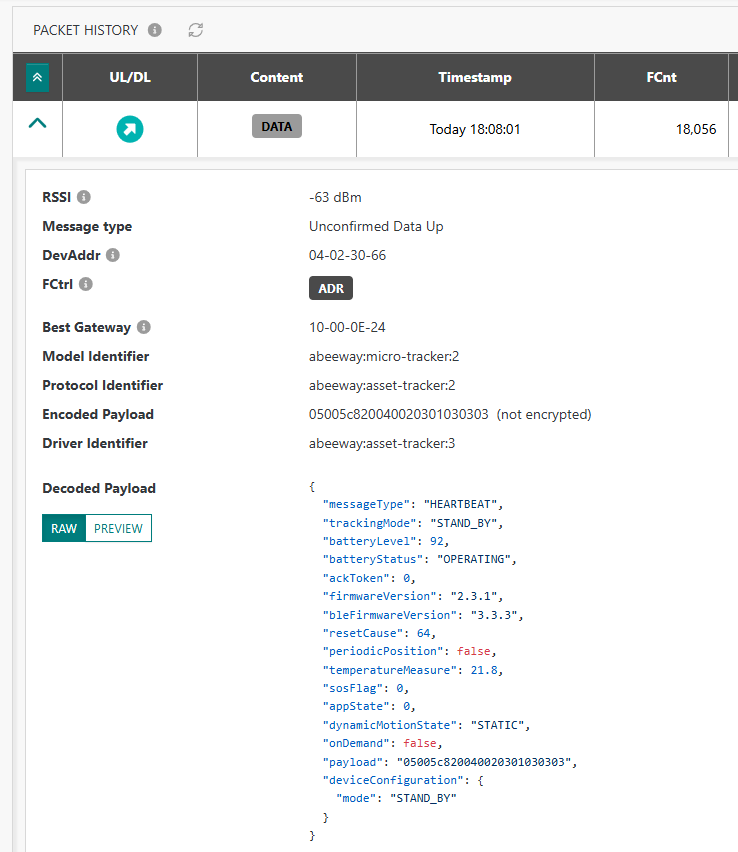
 to view more details about each packet, such as the MAC header and the packet content.
The MAC header of each packet is displayed in decoded format, allowing to easily check the ACK and ADR flags (among others).
If the packet contains DATA, the data payload is displayed in encoded format, it is also displayed in decoded format if a valid driver is associated with this device.The driver metadata shows the protocol identifier associated with the device when the payload was received and the driver identifier of the selected driver (system or custom). To learn more about driver metadata, see Device attributes.
You may encounter one of the following situations:
-
There is no protocol identifier for this packet: no driver can be selected for payload decoding. The display looks like this:
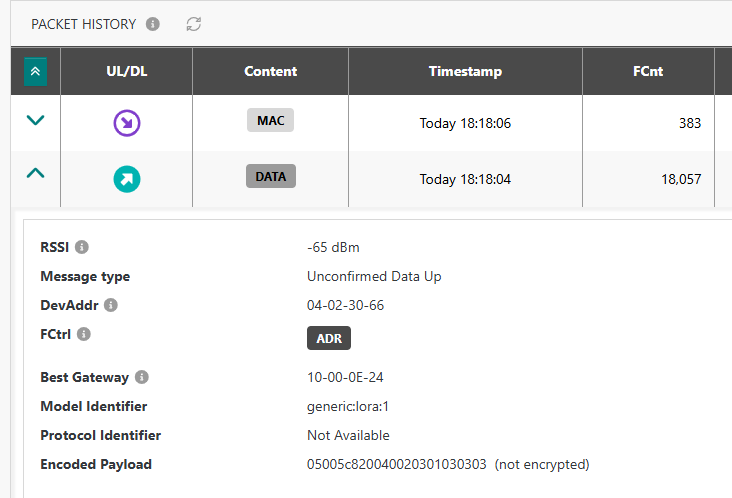
For more information, see Troubleshooting payload decoding issue.
-
There is a protocol identifier for this packet: a payload driver exists for the corresponding device and the payload has been decoded. The default display looks like this:
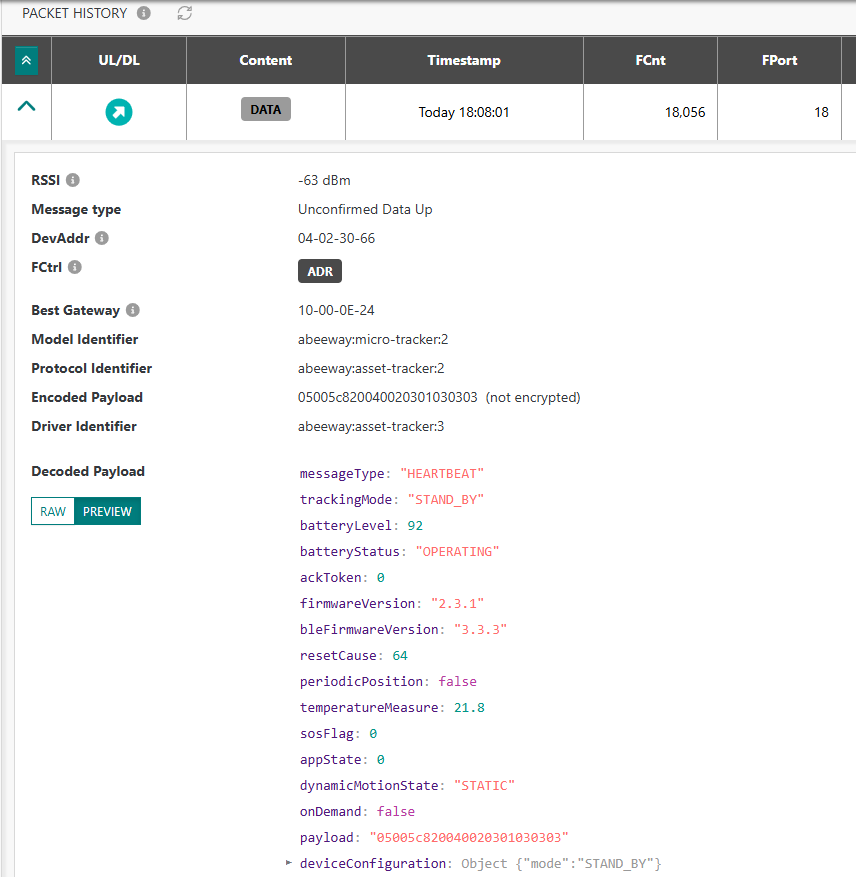
The PREVIEW mode shows the JSON document in tree view (collapsed by default).
Clicking RAW opens the raw view of the decoded payload. This looks like this:
Switching between the RAW and PREVIEW modes is stored in the local storage of the browser and is automatically selected for all packets.
noteWhen exporting the packet list in csv format, the driver metadata is included but the payload is not decoded in the export file.
-
-
Switch to the Last MAC commands tab to see up to the last 10 MAC commands in decoded format.
-
To view more packets than the last 10 displayed in this widget, click SHOW ALL at the bottom of the widget.
-> This takes you to the Wireless Logger application to view the entire traffic history and get additional details.
Checking the location history
This task applies only to the case when the location mode of your device is set to Network Geolocation.
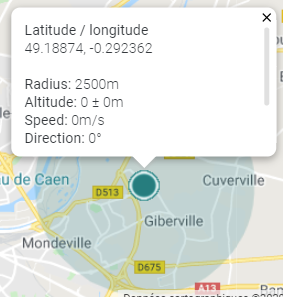
If your device is successfully geolocated by the network, the location history is traced on the map of the Location widget.
-
The last known location is pointed with a marker. Clicking the marker reveals the location details.
-
The last location precision is displayed with a circle around the marker.
-
The traced location history can be modified using the clock icon on the right side of the widget.

By default, "no history" is selected. Only the last 1000 locations reported on the requested period can be displayed on the map.
-
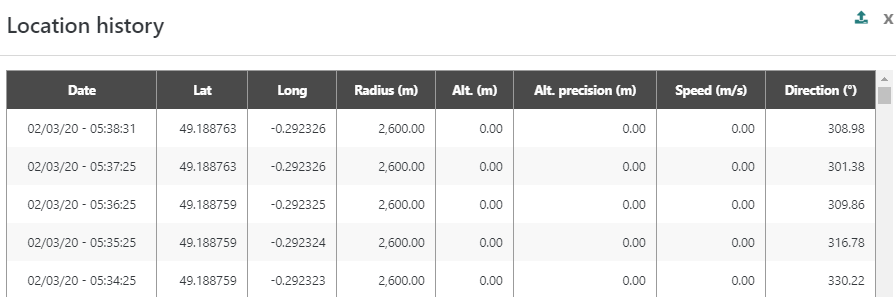
You can also view all location details for the seven days preceding the last reported location. To do this, click the
icon on the right side of the Location widget.A new window opens, showing the location history as per the following example: