Tracking your assets
Start to track your assets using the Abeeway Device Manager application. At the end of this step, you will be able to view your trackers on a map and monitor their performance, such as battery level.
Abeeway Device Manager is a ThingPark Location application designed to help you manage your fleet of trackers efficiently. With Abeeway Device Manager, you can:
-
Track your assets on a map, displaying its latest position or its position history
-
Manage your trackers configuration, using our predefined configuration templates or building your customized parameter set
-
Assess trackers performance: radio performance monitoring, location technology usage, battery level monitoring.
We recommend you do a drive or walk test with your tracker to display and analyze a number of reported locations. You can also place the tracker in a moving asset you want to locate.
-
Log in to Abeeway Device Manager on the ThingPark Community platform using this URL: here. If you are using some other platform, please refer to ThingPark Location URLs
-
In the Select Devices column, select the tracker you want to see the location, and click Select.
You can select up to ten trackers to be shown and analyzed at the same time.
![]()
-
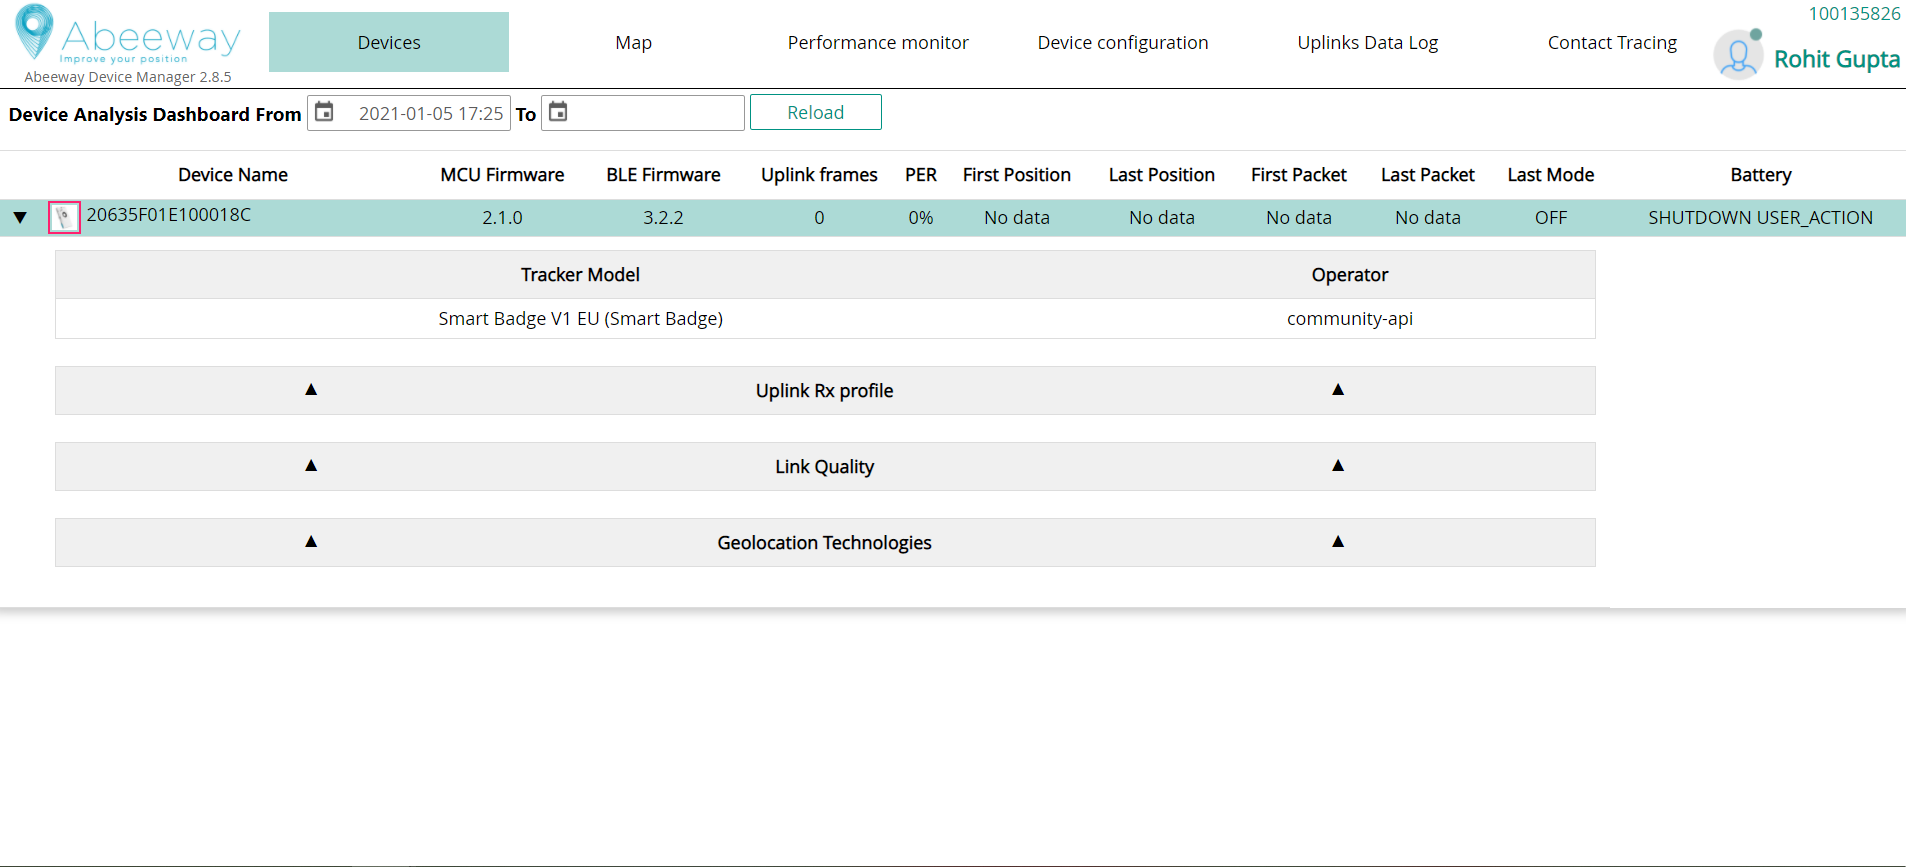
In the Device Analysis Dashboard that opens, the tracker you have selected displays its status details and statistics. Click the arrow to expand the tracker information. The information relevant to notice is:
- MCU Firmware : It gives the tracker MCU firmware version. Please refer to the Abeeway trackers reference guide matching the MCU Firmware version to know the supported features.
- First Position and Last Position of the tracker
- Last Mode : Current mode of the tracker
- Battery : Percentage of remaining battery
-
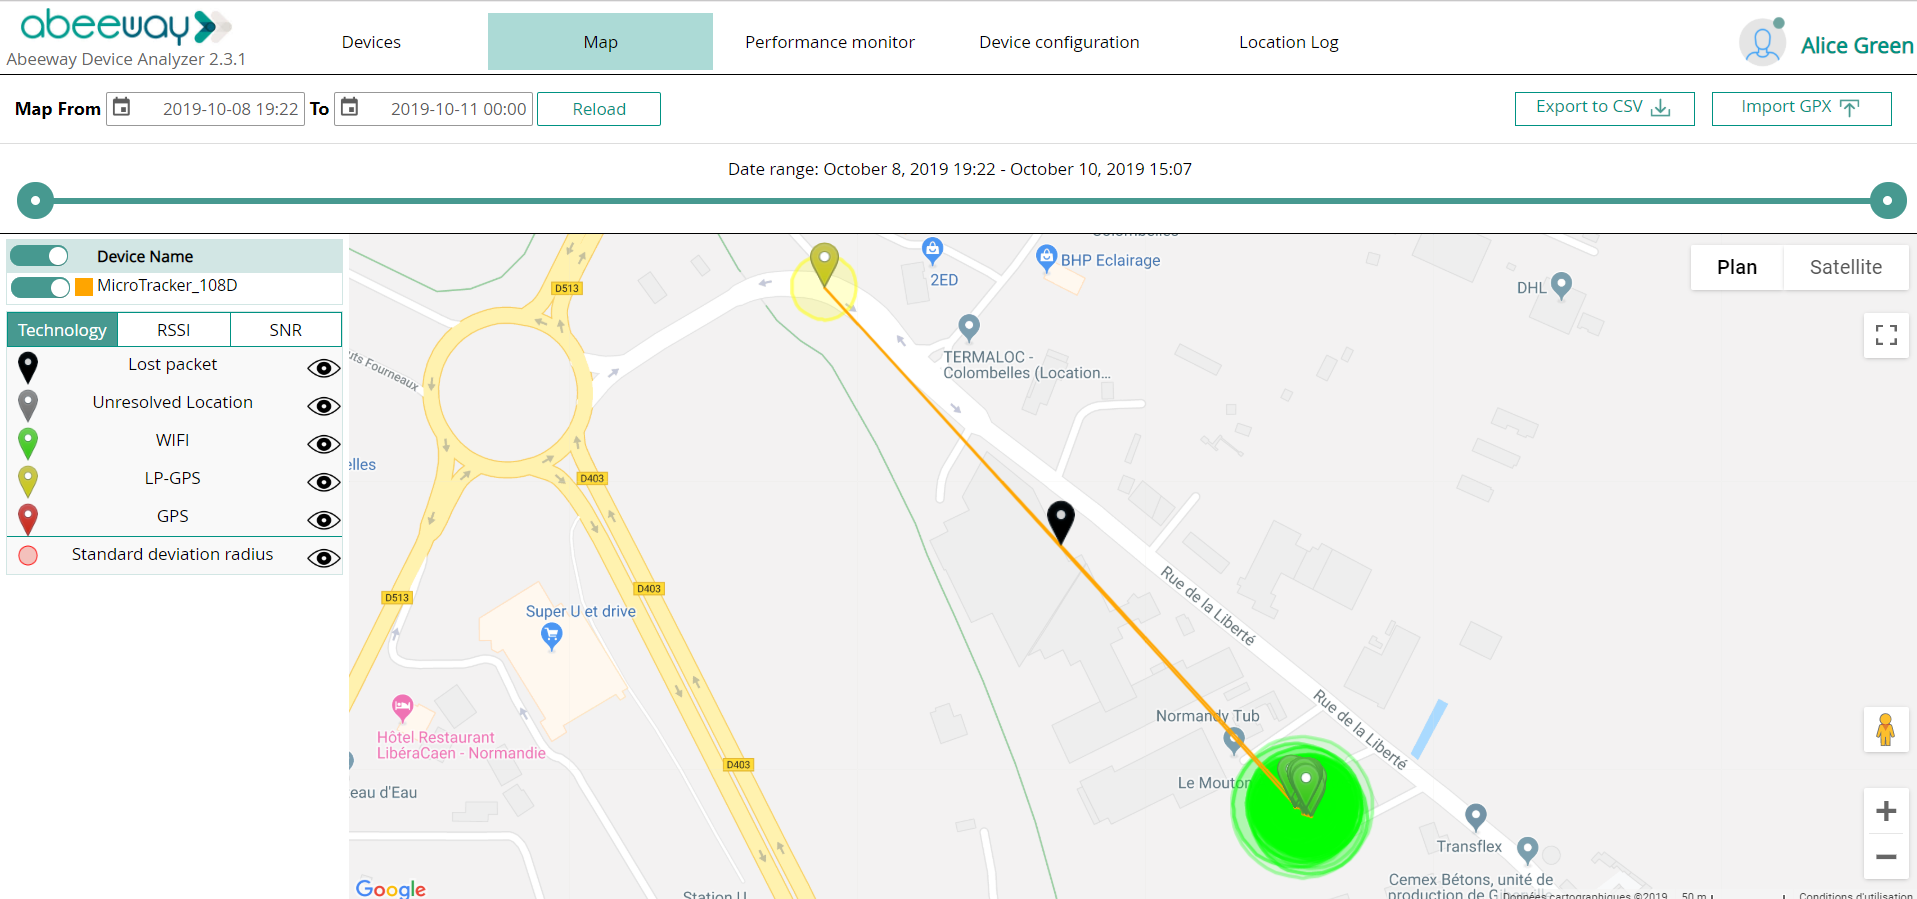
Click the Map tab to see the reported locations of your tracker.
-
Once you have located your tracker positions on the map, zoom in or out to get the best view of them.
-
Click all the eyes to close them, then click them again slowly one by one to display each packet separately and discriminate the information. When Standard Deviation Marker is selected, a green circle is displayed around the location representing the position accuracy.
-
Click a marker to display more information.
-
Use the slider slowly to monitor a period of time where you want to display locations on the map accordingly.
-
-
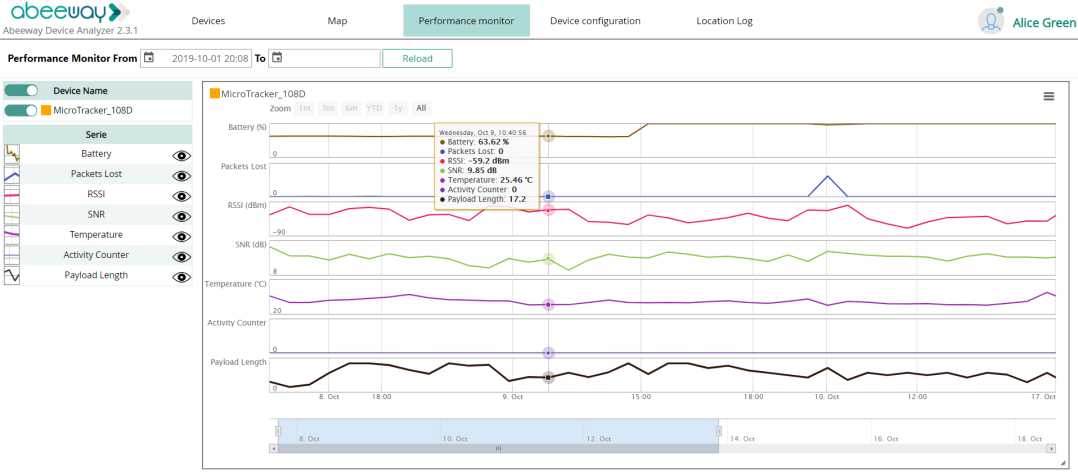
Click the Performance monitor tab to display statistics about your tracker.
-
When opening, only the battery chart is displayed.
-
Click the eyes to display more charts.
-
Pause the mouse over the charts to display the date and details of the packets.
-
Use the slider to change the monitoring period range.
NoteFor a given tracker, all the sliders are synchronized between each other.
-
-
For more information about how to use Abeeway Device Manager, see Abeeway Device Manager User Guide.