Network Coverage overview
ThingPark's Network Coverage tool allows simulating the RF coverage provided by outdoor macro gateways installed on high points, for instance, building rooftops or mounted on towers.
The tool should not be used to simulate the RF coverage of indoor gateways.
The following video gives you a quick demonstration of this tool:
This tool may be used to:
-
Predict RF coverage for greenfield deployments and determine the optimum antenna placement.
A typical use case is: you plan to deploy a new LoRaWAN network and want to check that the gateway locations are well chosen to cover the area of interest. -
Automatically select the best gateway locations needed to reach the target coverage requirements, out of a list of potential/candidate gateway locations.
The coverage requirements may either be based on a geographical area of interest, or a dataset of LoRaWAN devices to serve. -
Generate coverage heatmaps for already-deployed gateways and detect potential coverage holes. The predicted RF coverage may also help you optimize the LoRaWAN radio configuration of your network, such as RX2 data rate, the maximum number of transmissions per uplink packet (frame repetition) etc.
-
Add new gateways to your existing network, to fill coverage gaps: in this case, you can rely on the coverage predictions provided by the tool to choose the optimum location of your new gateways.
-
Enable roaming actors (selling LoRaWAN connectivity) to publish their coverage maps on ThingPark Exchange to promote the connectivity provided by their gateways.
The tool is seamlessly integrated with ThingPark SaaS, so you can easily reuse the provisioning data (coordinates, antenna height, propagation environment...) of your existing base station fleet to predict their RF coverage.
Coverage heatmap generation
ThingPark Network Coverage relies on Digital Elevation Maps to account for the shadowing effects caused by the terrain topography. Additionally, the tool embeds a rich set of LoRa antenna patterns in the sub-GHz frequency range.
The Network Coverage tool relies on empirical propagation models calibrated specifically for each propagation environment and validated by field test measurements. These propagation models are suitable for outdoor gateways having their RF antenna located on high points (above rooftops or on masts). The tool is not calibrated to simulate the RF coverage of outdoor antennas that are installed on bus stops or lampposts and surrounded by higher buildings.
Two propagation models are supported by the tool, one offering slightly-conservative prediction results and another offering more optimistic prediction results. The propagation model selection is driven by the parameter Prediction type, defined by users while defining the configuration parameters of new simulation requests.
Radio planning process overview
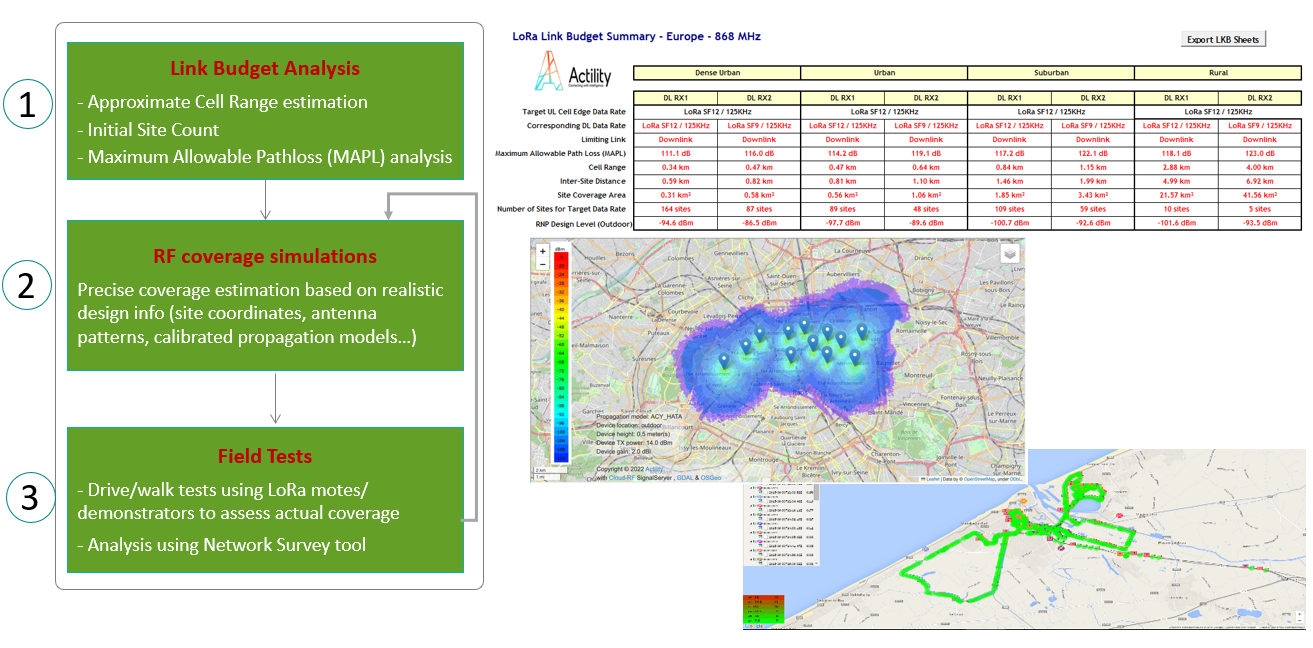
The following diagram shows the different steps of a typical radio planning process:

The following video illustrates the main steps of this process in more details:
At any step of this process, if you want to analyze the noise level within the frequency band used in your deployment, you can rely on ThingPark's Spectrum Analysis tool.
Link budget analysis
The first step to deploy a new LoRa network is to establish the Link Budget. This is an important step to determine the limiting link of your design (uplink or downlink) as well as the maximum allowable path loss (MAPL).
To realize this analysis, ThingPark provides you with:
-
The standalone excel-based Air Interface Dimensioning tool. Besides link budget analysis, this tool helps you simulate the RF capacity offered by your network according to your traffic profile assumptions.
-
The link budget calculator embedded with ThingPark's Network Coverage Tool and available via a swagger API, accessible from the Help button at the top-right of the tool's user interface.
RF coverage simulations
To predict the RF coverage of your existing and/or candidate gateways, use ThingPark's Network Coverage tool. The tool embeds a link budget calculator to estimate the maximum allowable path loss according to your design assumptions.
The cell range predicted by this tool is more accurate than the analytical cell range estimation provided by the link budget analysis: the Network Coverage tool accounts for several realistic factors not considered by step #1, such as:
- the exact site coordinates of each gateway,
- the real antenna patterns, with radiation diagrams in both horizontal and vertical planes,
- the terrain topography,
- the clutter mix within a geographical area.
To access the Network Coverage tool, see Logging-in.
Field tests
Once the gateways are deployed, you may need to verify the effective coverage provided by these gateways, by conducting some field tests. ThingPark's Network Survey tool allows you to easily analyze your walk-test data and visualize the different RF metrics on a user-friendly interface.