Checking the device statistics
The detailed page of each device provides a rich set of metrics and radio statistics, allowing you to monitor the device performance and troubleshoot its connectivity to ThingPark.
-
From the left pane, select Devices, then search for the device you want to view.
-
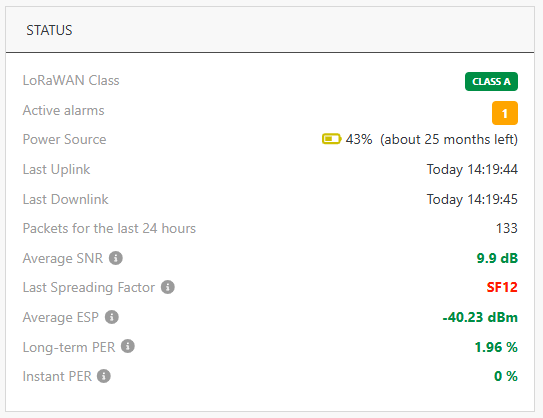
Check-out the STATUS widget to get a quick overview of the device's main metrics.
For more information about each metric, see Dynamic device attributes.An example of this widget is shown below:
 note
noteWhen the LoRaWAN class badge shows
 in grey, the device is class-B capable
but the class B mode is not currently used by the device, so it acts in class A mode.
in grey, the device is class-B capable
but the class B mode is not currently used by the device, so it acts in class A mode. -
In the STATUS widget, if there are active alarms, click the colored badges to find out which alarms are currently raised on your device. Each alarm severity is represented by a color: red for critical alarms, orange for major alarms, etc.
-
In the RADIO TRAFFIC HISTORY widget, check-out the time evolution of the LoRaWAN traffic exchanged between the device and the network.
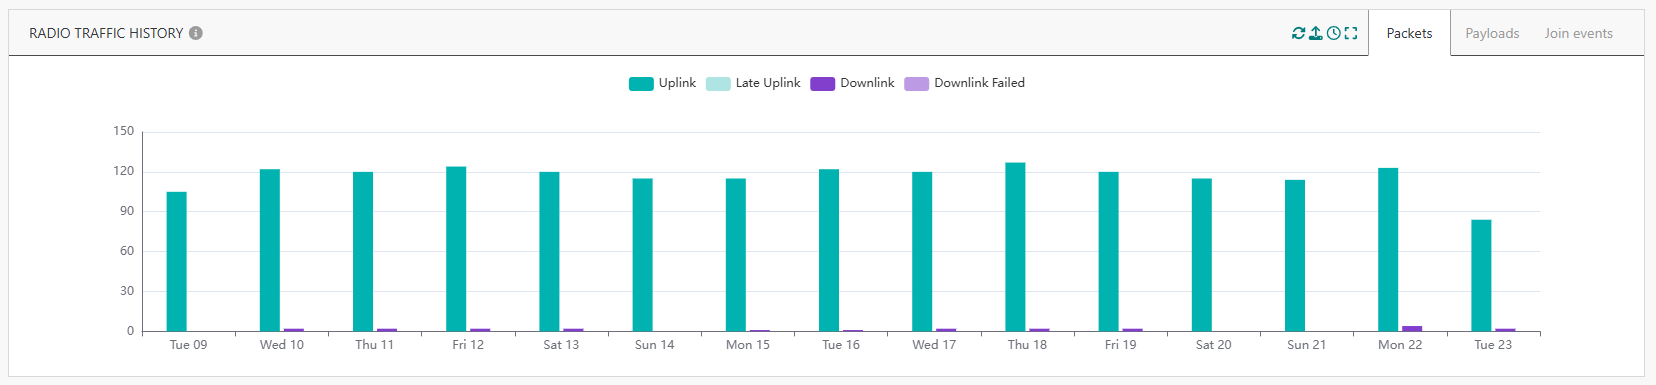
Packets show all uplink/downlink packets regardless of the message type while Join events only show Join Request/Join Accept messages. Payloads show the aggregated volume of uplink/downlink applicative data payloads in bytes.
-
Uplink represents the packets/payloads received on-time by the network server, without being queued in the base station. The same thing applies to Join Requests in the "Join events" tab. Repeated (duplicated) packets are not counted.
-
Late uplink represents packets/payloads that are received late by the network server, as they were queued in the LRR due to a temporary disconnection of the backhaul between the base station and the core network. The same thing applies to Join Requests in the "Join events" tab. Repeated (duplicated) packets are not counted.
noteThe distinction between on-time and late uplink packets is only supported by the LRR packet forwarder. Basics Station does not offer this capability.
-
Downlink represents downlink packets successfully sent by the base station to this device over the air. The same thing applies to Join Accepts in the "Join events" tab.
-
Downlink failed represents downlink packets intended for this device but they were not successfully sent over the air. This may be due to radio constraints on the base station (for instance, duty cycle, radio congestion). The same thing applies to Join Accepts in the "Join events" tab. To learn more about the failure cause of each downlink packet, refer to Wireless Logger.
TipsUse the
 at the top right of the widget
to set the required time scale.
at the top right of the widget
to set the required time scale.
You can visualize this graph up to the last 15 days, using daily or hourly aggregations.You may mask an item from the graph by clicking it in the legend.
-
-
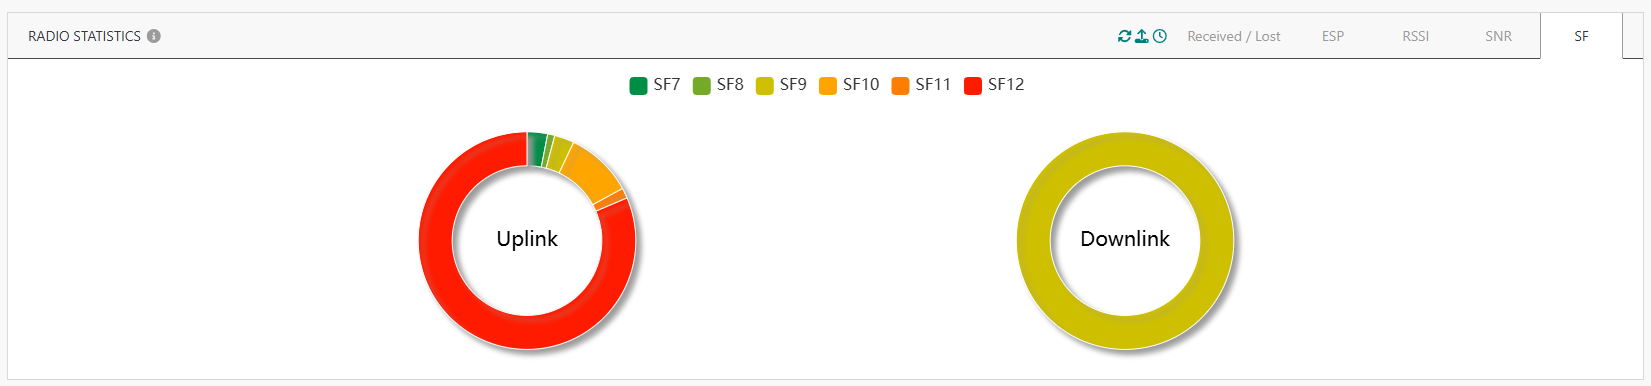
In the RADIO STATISTICS widget, check-out the time evolution of the main radio metrics associated with your device. To learn more about each radio metric, see see Dynamic device attributes.
-
Received/Lost: Successfully-received uplink packets versus the lost ones.
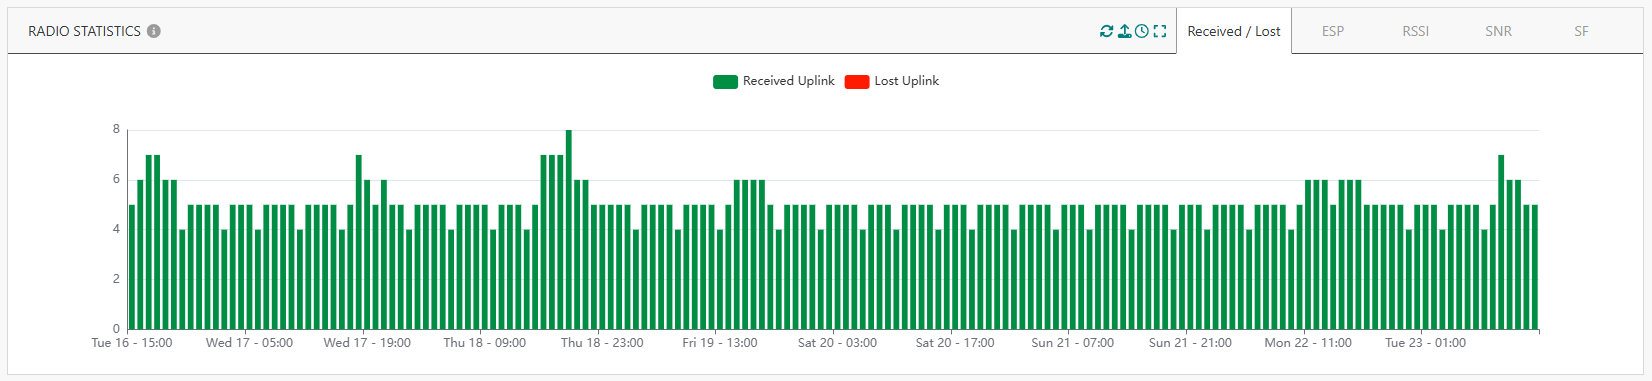
- Received uplinks are the sum of on-time and late uplinks.
- A lost uplink is an uplink that has never been received by ThingPark. The lost uplink is detected when ThinkPark receives the following uplink.
-
ESP: Estimated Signal Power of the received uplink packets
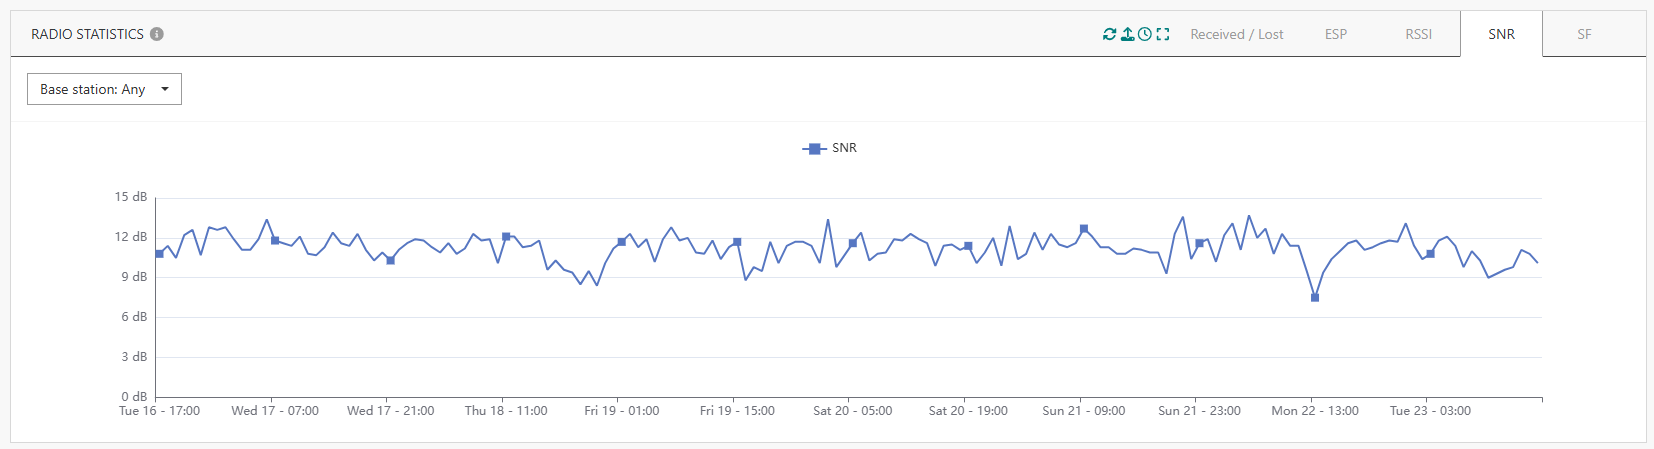
noteOn the ESP/RSSI/SNR tabs, you may show the graph for a specific base station. The list shows up to three base stations (identified by LRR-ID) that received the last uplink of the device.
The default setting is “any” base station, which means that data represents the best gateway for each uplink, averaged over hourly or daily periods. -
RSSI: Received Signal Strength Indicator of the received uplink packets
-
SNR: Signal to Noise Radio of the received uplink packets.
-
SF: Pie-chart representation of the LoRaWAN Spreading Factor of the received uplink packets.
-