Checking the device statistics
The detailed page of each device provides a rich set of metrics and radio statistics, allowing you to monitor the device performance and troubleshoot its connectivity to ThingPark.
-
From the left pane, select Devices, then search for the device you want to view.
-
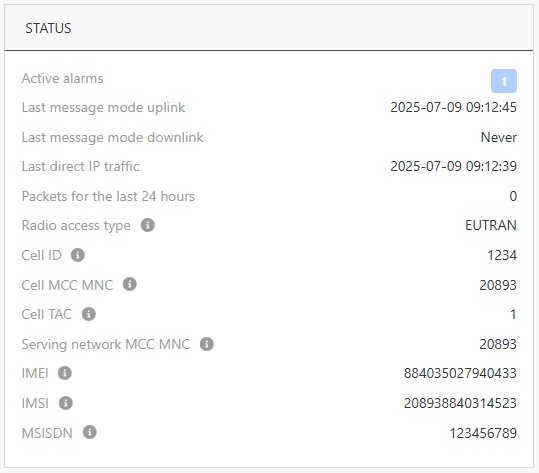
Check-out the STATUS widget to get a quick overview of the device's main metrics.
For more information about each metric, see Dynamic device attributes.An example of this widget is shown below:
-
In the STATUS widget, if there are active alarms, click the colored badges to find out which alarms are currently raised on your device. Each alarm severity is represented by a color: red for critical alarms, orange for major alarms, etc.
-
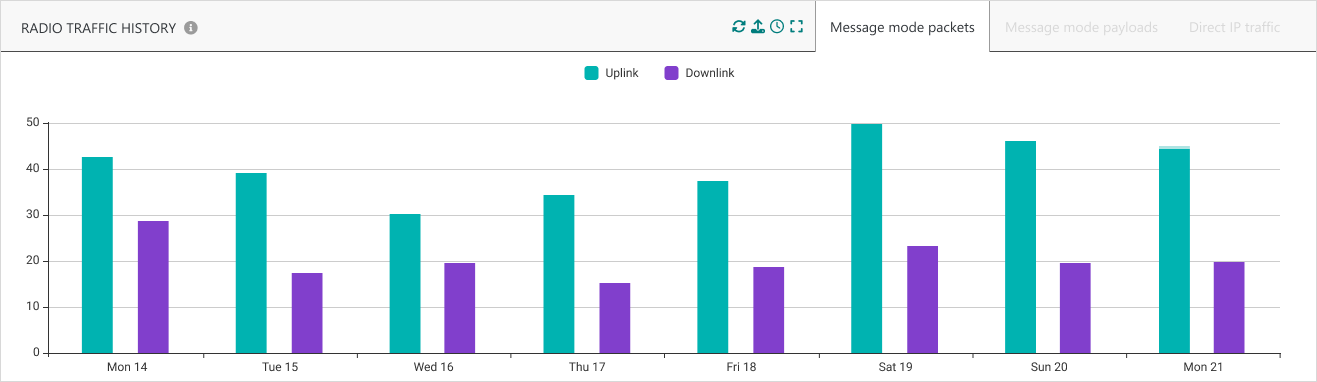
In the RADIO TRAFFIC HISTORY widget, check-out the time evolution of the cellular traffic exchanged between the device and the network.
-
Message mode packets show all message mode uplink/downlink packets.
-
Message mode payloads show the aggregated volume of message mode uplink/downlink applicative data payloads in bytes.
-
Direct IP traffic shows the aggregated volume of direct IP mode uplink/downlink traffic in bytes.
TipsUse the
 at the top right of the widget
to set the required time scale.
at the top right of the widget
to set the required time scale.
You can visualize this graph up to the last 15 days, using daily or hourly aggregations.You may mask an item from the graph by clicking it in the legend.
-