Using the device dashboard
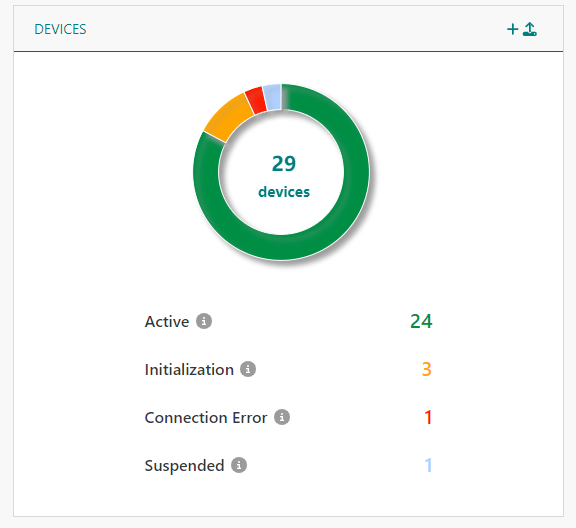
You can access the dashboard when logging in or whenever you want to get a synthetic view of all the devices of your account. The dashboard shows the distribution of devices filtered by health state and the ten most recent alarms ordered by descending severity.
The dashboard also allows you to:
-
Get a direct access to:
-
Health-filtered, custom and full lists of devices.
-
All the active device alarms of your account.
-
-
Provision a device if you have read-write access on devices.
-
Download pie chart images.
-
Click Dashboard.
-> The dashboard appears.

-
In the DEVICES widget, the devices are displayed and filtered according to Devices health states.
Do one of the following Action To display the number and percentage of devices having the same health state Hover your pointer over a pie sector. To access the devices having the same health state Click either a pie sector or the corresponding colored number.
-> When entering the list, Active filters displays the corresponding Health state filter.
To access your devices custom-list Click DEVICES.
-> If you have customized the list to your needs by selecting filters, sorting or adding /deleting columns, your choices are applied.
To access all devices of your account Click the total number of devices inside the pie-chart, then if Clear all is displayed, click it to remove persistent filters. Note When in the device list, you can change the filters to your needs. For more information, see Filtering devices and More list activities.
-
In the DEVICES widget:
-
If you have write access, click
to provision a device.
-
Click
Download chart to download an image of the chart, then select the image format (PNG, JPEG, or PDF) you want.
-
-
In the RECENT ALARMS widget, you can see up to ten recent alarms out of the total number of alarms. To access all your account alarms, click RECENT ALARMS.
-> Active filters are: Min. state: Indeterminate, Acked: No. When in the list, you can customize it to your needs.