Monitoring the connections' performance
This topic lists the tasks that you can perform in the ThingPark user interface to analyze the performance of your connections.
To open a specific connection, click Connections from the left panel then select the connection you want to monitor, by clicking its name.
If your ThingPark subscription is partitioned via administrative domains, non-Administrator users can only view the traffic data limited to devices matching their domain restrictions.
Viewing the last reports of a connection
Follow these steps if you want to analyze the last uplink/downlink packets exchanged over a given connection:
-
On the connection's detailed page, go to Last 25 Reports widget.
-
In the Report type column, you can see a graphical representation of the packet type and the packet content.
To learn more, see Analyzing LoRaWAN® traffic and Analyzing cellular traffic.
-
For "Basic HTTPS" connections, the "Delivery to app." column displays the transmission status of uplinks reports sent to the Application Server:

The meaning of each delivery status is described below:
Status Explanation Successful delivery to the application server. Failed delivery. Error details are displayed in the expandable zone of the uplink:
- Timeout: The uplink was not successfully acknowledged by the destination within the expected timeframe,
- Error: The uplink was rejected by the destination. (HTTP error, network error, DNS error),
- Overload: The uplink was not sent to the destination because the network server reached the OVERLOAD state and the destination's average round trip time is too high,
- Blacklist: The uplink was not sent to the destination because the network server reached the BLACKLIST state and the destination's average round trip time is high,
- Unreachable: The uplink was not sent to the destination because this destination was deemed unreachable due to irresponsive behavior over the last observation window.Not applicable. The delivery to application column only displays delivery status for uplinks. -
If an uplink/downlink report contains an applicative payload, you may view it by unfolding the line through the
icon.
Note A packet can be expanded only if it contains a payload.
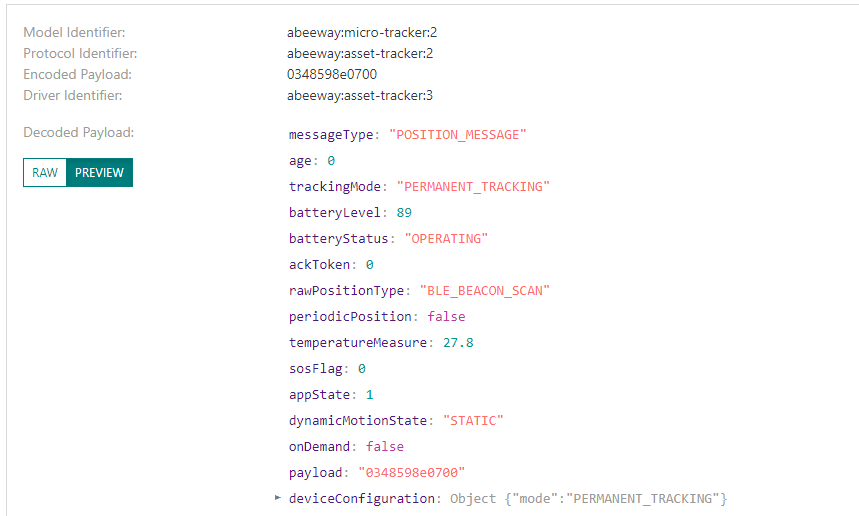
-> The default display looks like this:

-
The driver metadata shows the protocol identifier associated with the device when the payload was received and the driver identifier of the selected driver (system or custom). To learn more about driver metadata, click Devices' parameters.
noteThe decoding is triggered if the packet contains a payload and the device is associated with a protocol identifier from the device model (built-in) or with a protocol identifier of a custom driver created in the ThingPark X IoT Flow interface. Note that generic device profiles (using LoRaWAN® manufacturer) are not associated with any system driver so ThingPark cannot decode the application payloads of devices associated with generic device profiles, unless you associate them with a custom payload driver.
-
The PREVIEW mode shows the JSON document in tree view (collapsed by default). The RAW mode shows the same JSON document in pretty-print appearance.
The choice of the payload display mode is stored in the local storage of the browser and is automatically selected for the next packets.
Note The driver metadata is included in the CSV export. However, the decoded payload is not included in the CSV export.
-
Checking the associated devices and multicast groups
Follow these steps to check which devices and/or multicast groups are currently associated with your connection.
-
On the connection's detailed page, go to Associated devices widget.
-
Click the Multicast Groups tab if you want to see the multicast groups associated with your connection.
-
To access the detailed page of a specific device or multicast group, click its name.
Use the button to export the list
in csv format.
Use the button to select which
columns to show in the table. This choice is then saved in your browser settings.
Checking the communication history of a connection
The Radio traffic history chart displays the uplink/downlink LoRaWAN traffic volume exchanged via this connection on daily or hourly basis for up to the last 15 days. This traffic is split into unicast and multicast types of LoRaWAN traffic.
-
On the connection's detailed page, go to Radio traffic history widget.
/-> It will display hourly traffic for the last 24 hours.
-
Click Multicast Packets or Multicast Payloads to display the number of multicast downlink packets or the accumulated size of multicast downlink payloads in bytes. To learn more, see Checking the radio traffic history of a multicast group.
To filter the packets and payloads displayed on the chart by type, click one of the type in the legend to exclude it from the chart. The excluded legend item is grayed out. Click again to include it.